
Price Action:
Candle Closes:
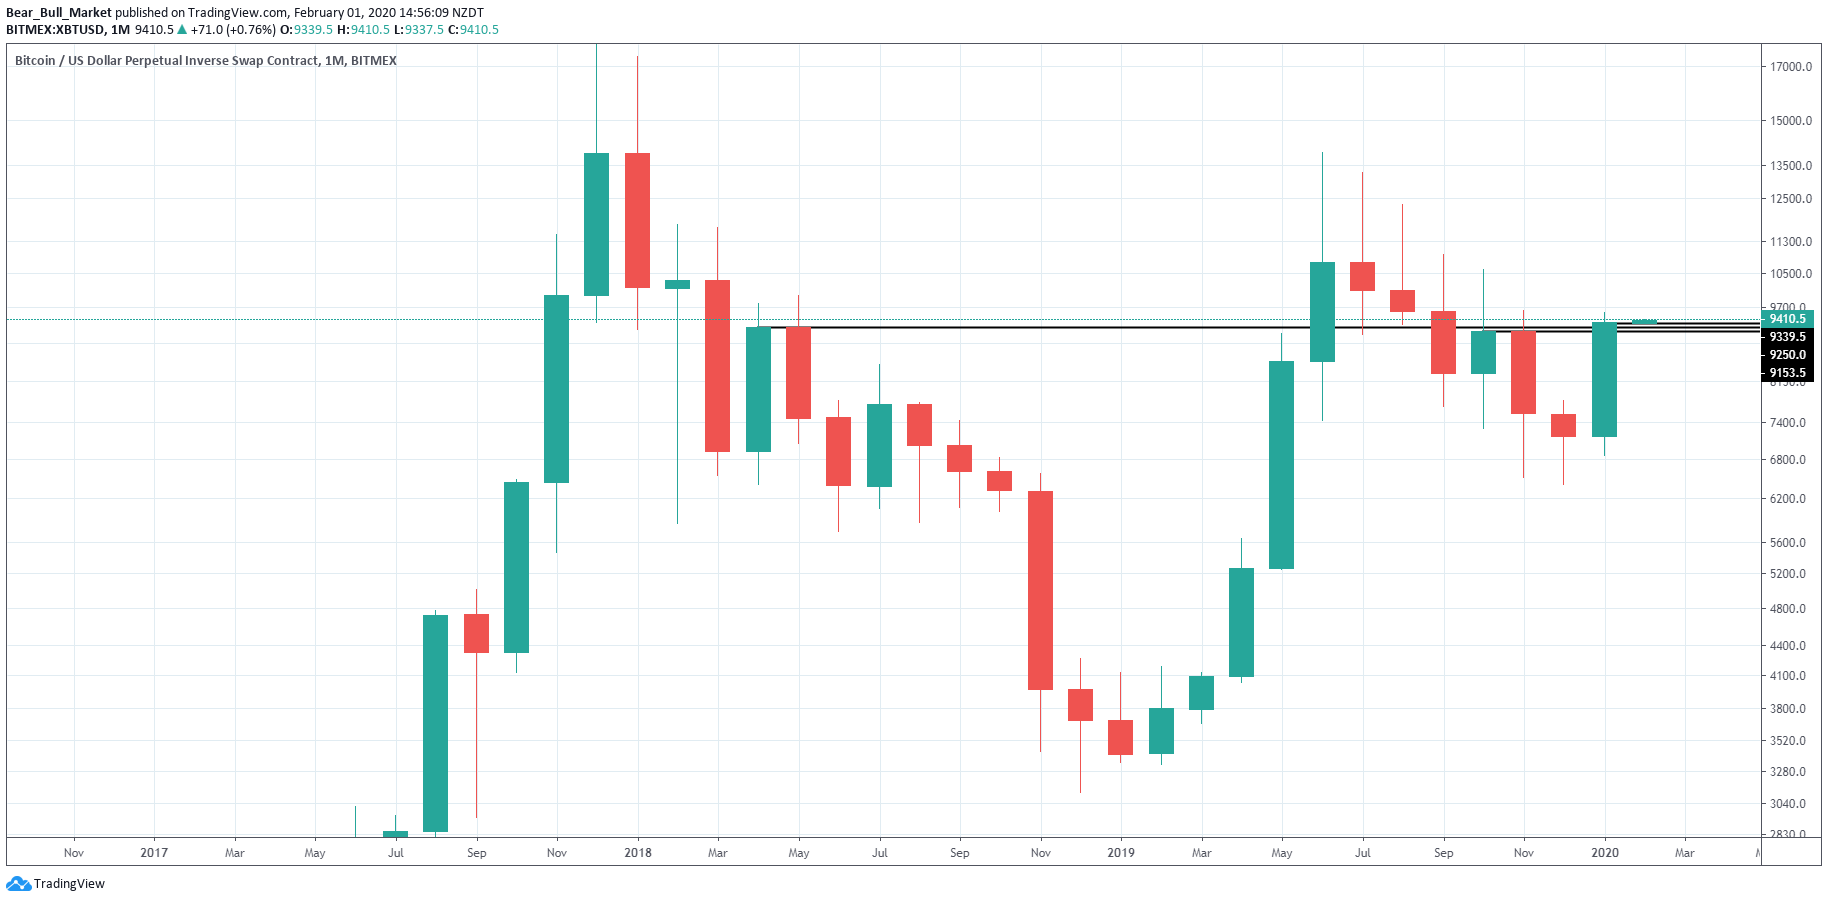
We’ve closed as a Bullish Engulfing candle. We’ve closed above the previous monthly candles from the relief rally from 4k and also from the previous descending triangle from 2018.
Close Price: $9339.5
Very Bullish Close!
View the Trading View Charts
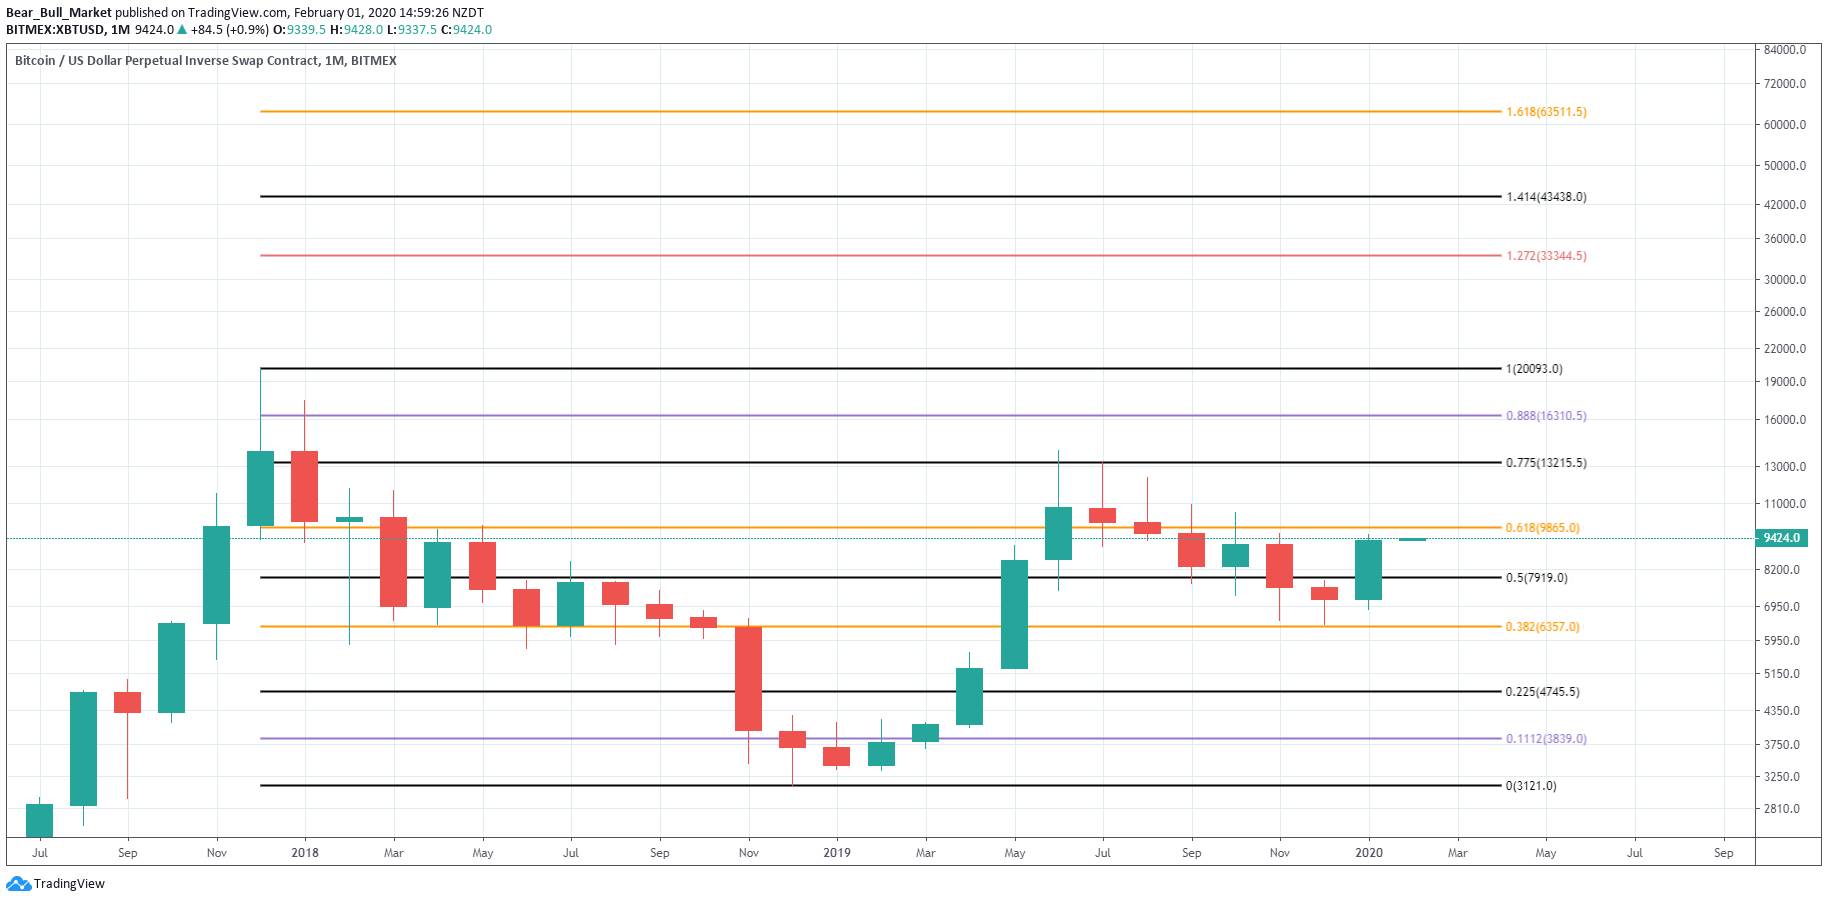
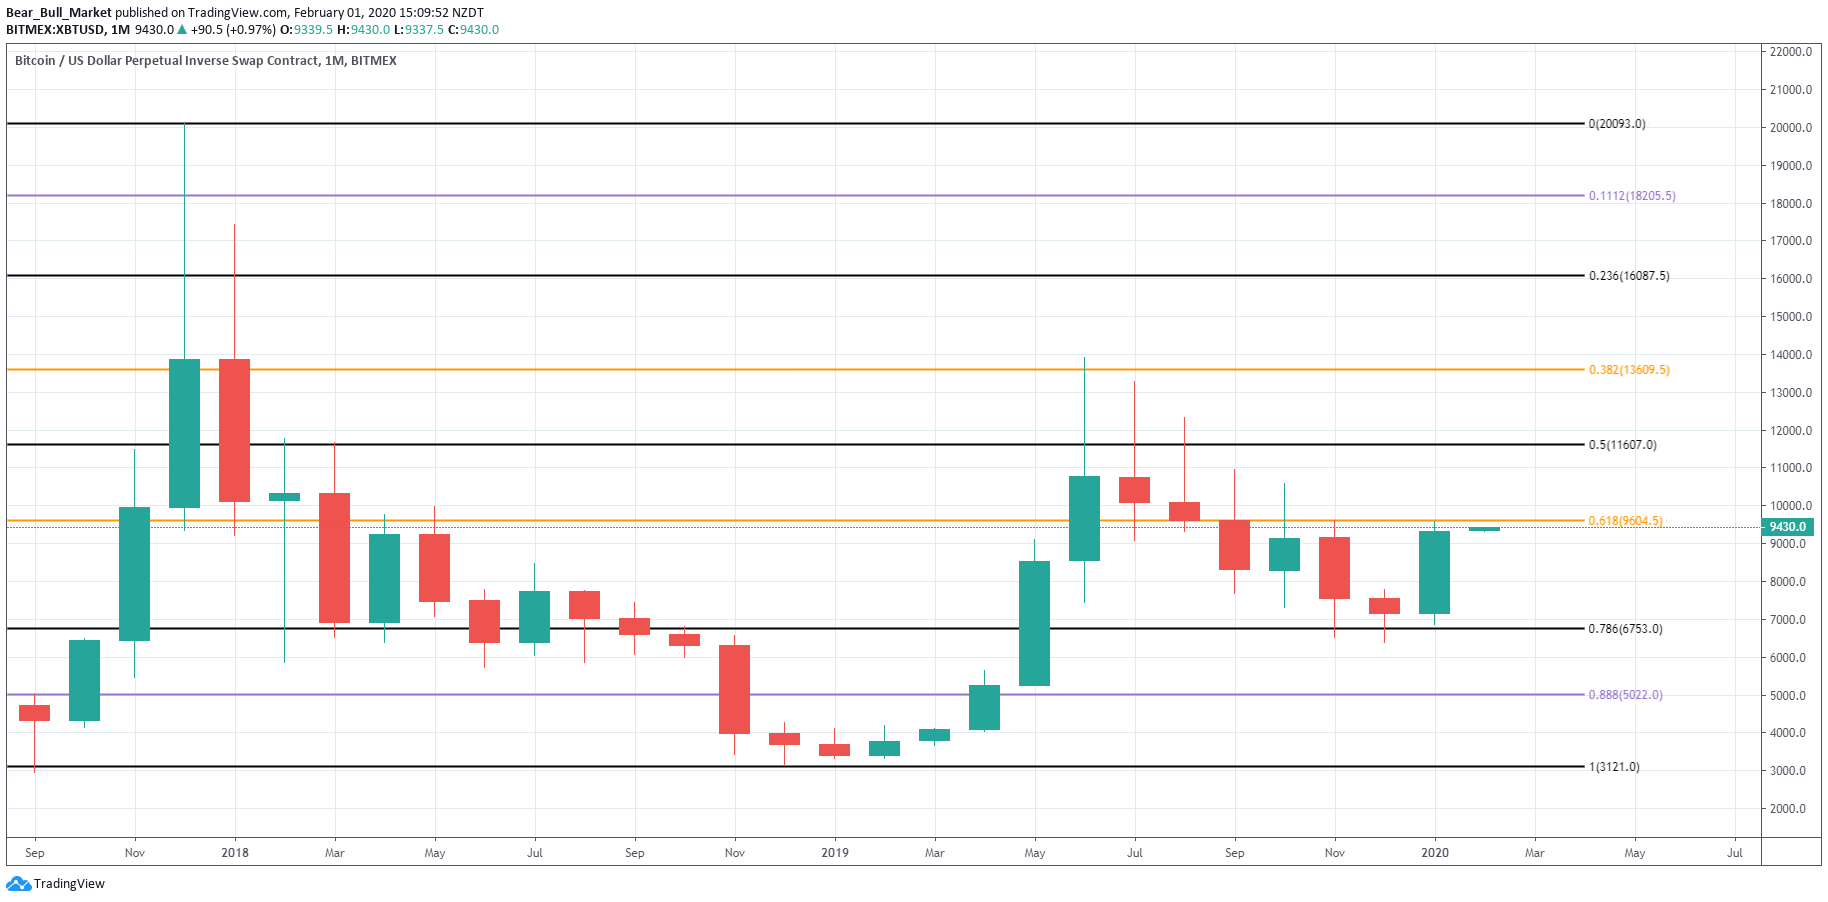
Looking at the Fib Retracement Tool from our All Time High (ATH) to the low of 2018-2019, we can see we rejected the 0.786 Fib level in our disbelief rally, and have since come down to the 0.382 Fib level for a nice touch before bouncing.
Ultimately, we need to reclaim $9,865 based off Log Scale Fib Retracement Tool to be extremely bullish, as that will as a launch pad to take us to $,63,511.5. Ridiculous number, however that’s fib trading, and this is the monthly scale.
View the Trading View Charts
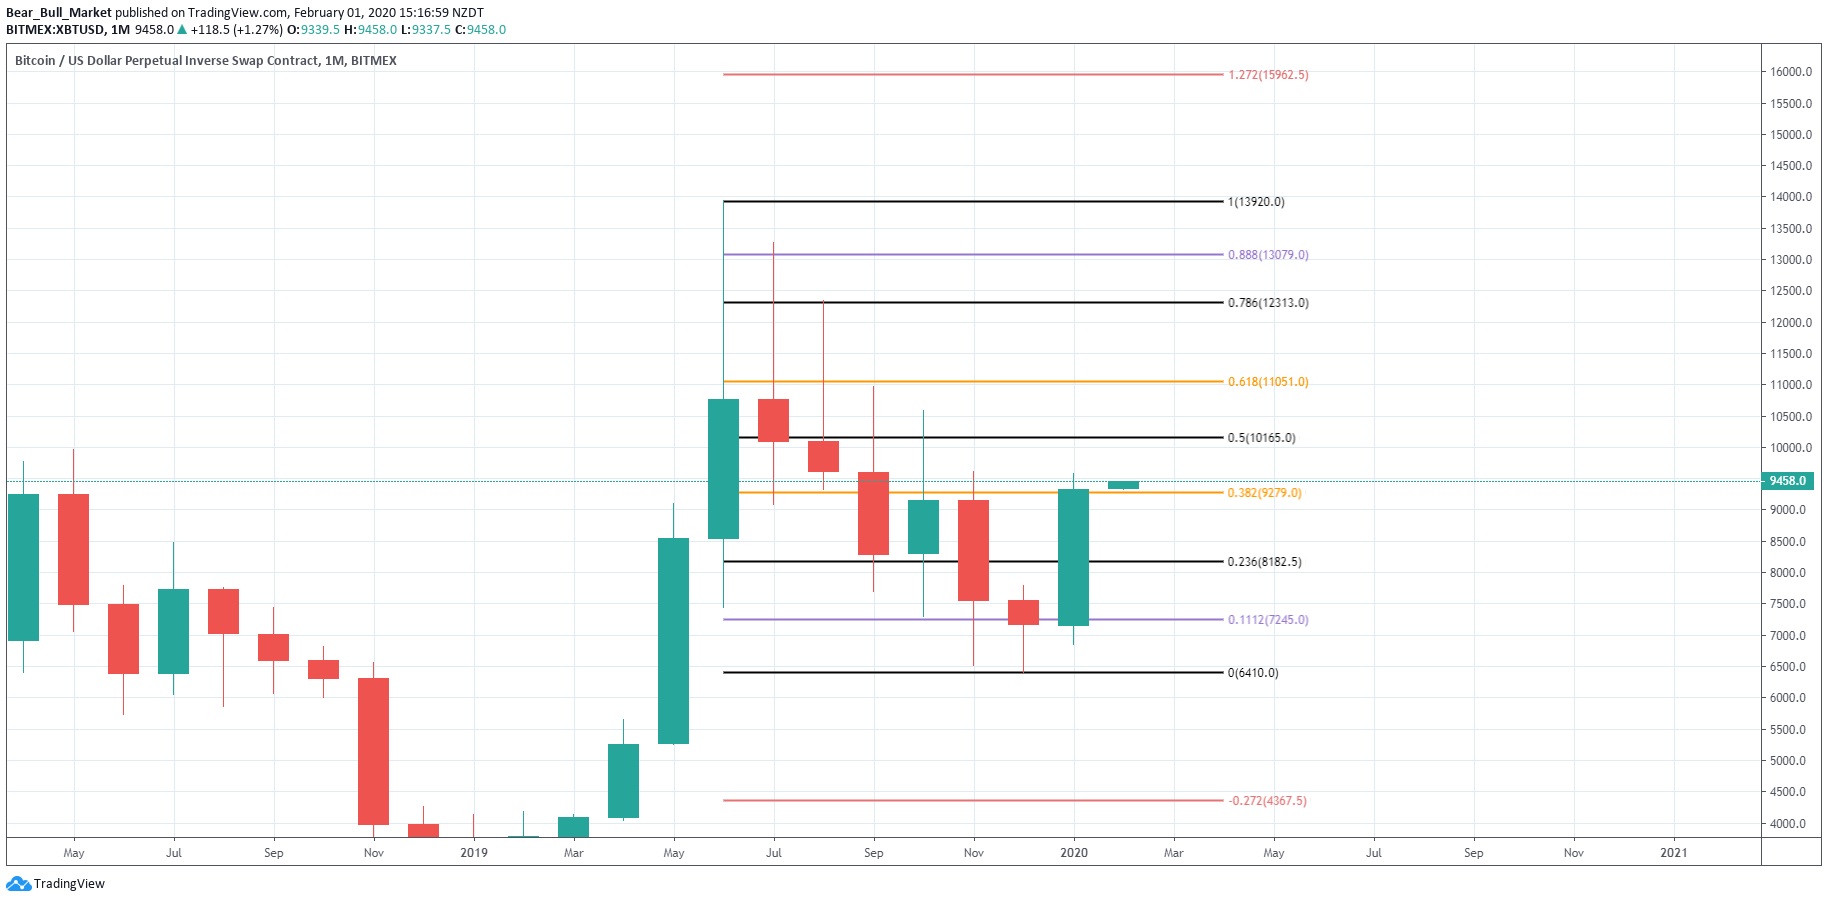
Furthermore, if we map from the Low of 2018-2019 to the top of our relief rally, we’ve retraced to the 0.5% Fib . Reclaimed the 0.382% Fib and have since launched. However, giving us a resistance of $9,781 overheard. If this is wave 2 of 5 macro waves, we’ve just achieved a nice retracement, 0.5% if favoured for the first pull back.
View the Trading View Charts
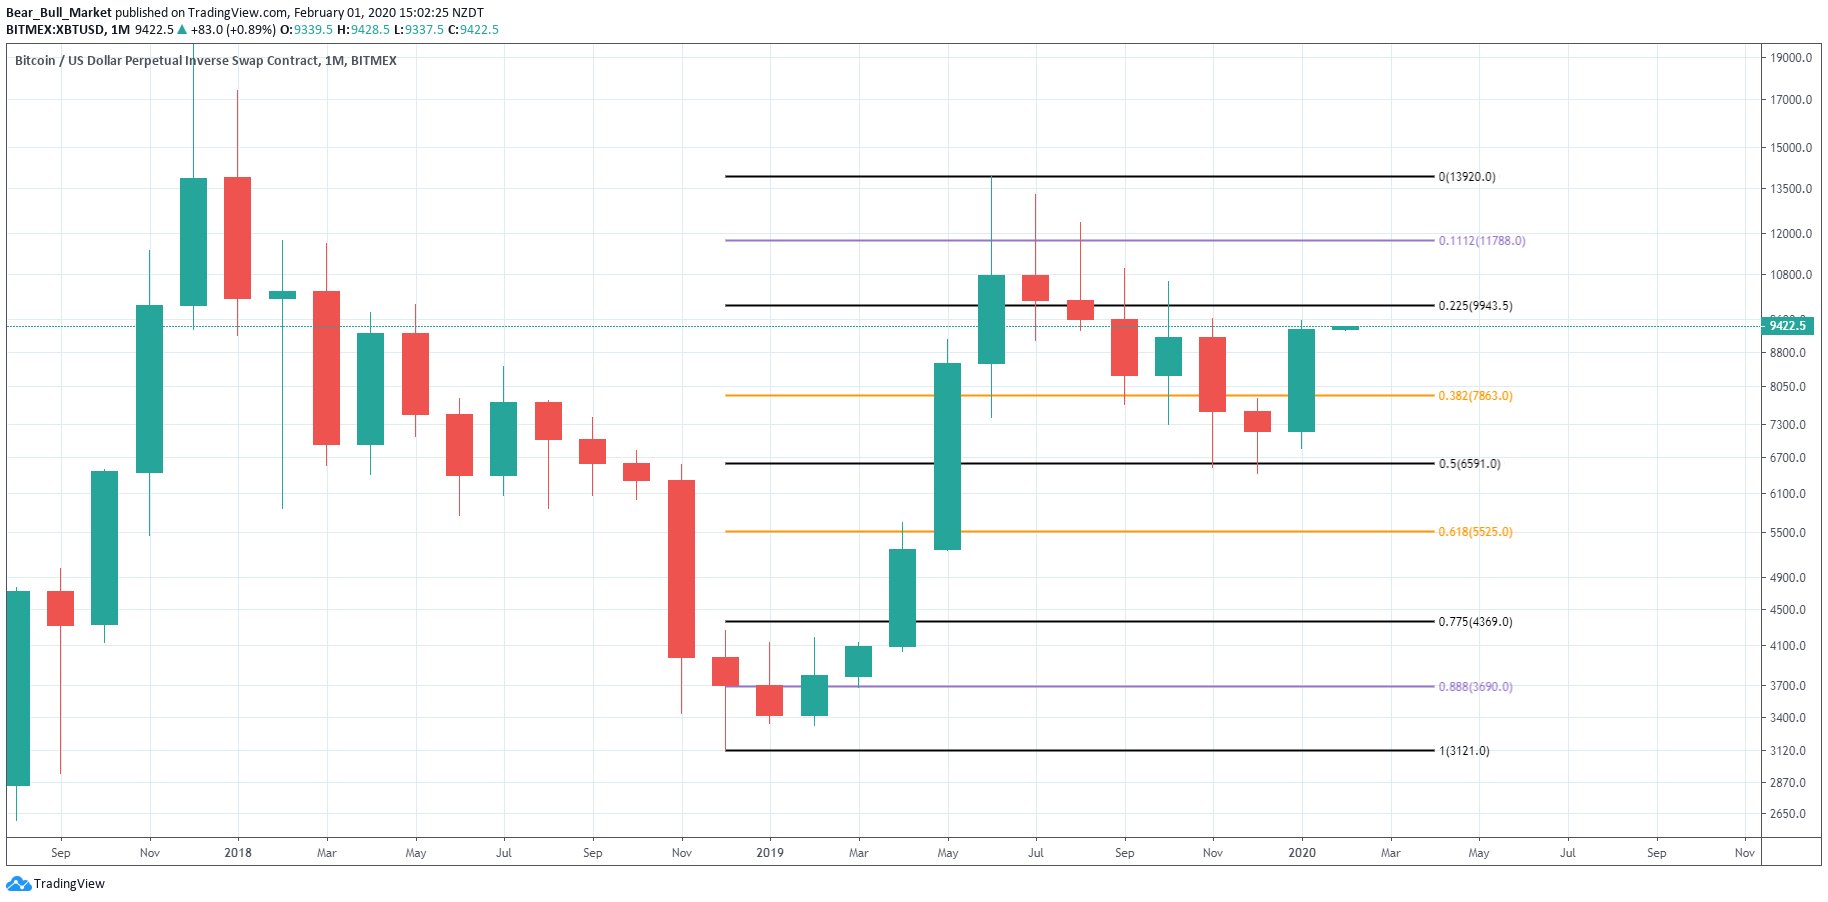
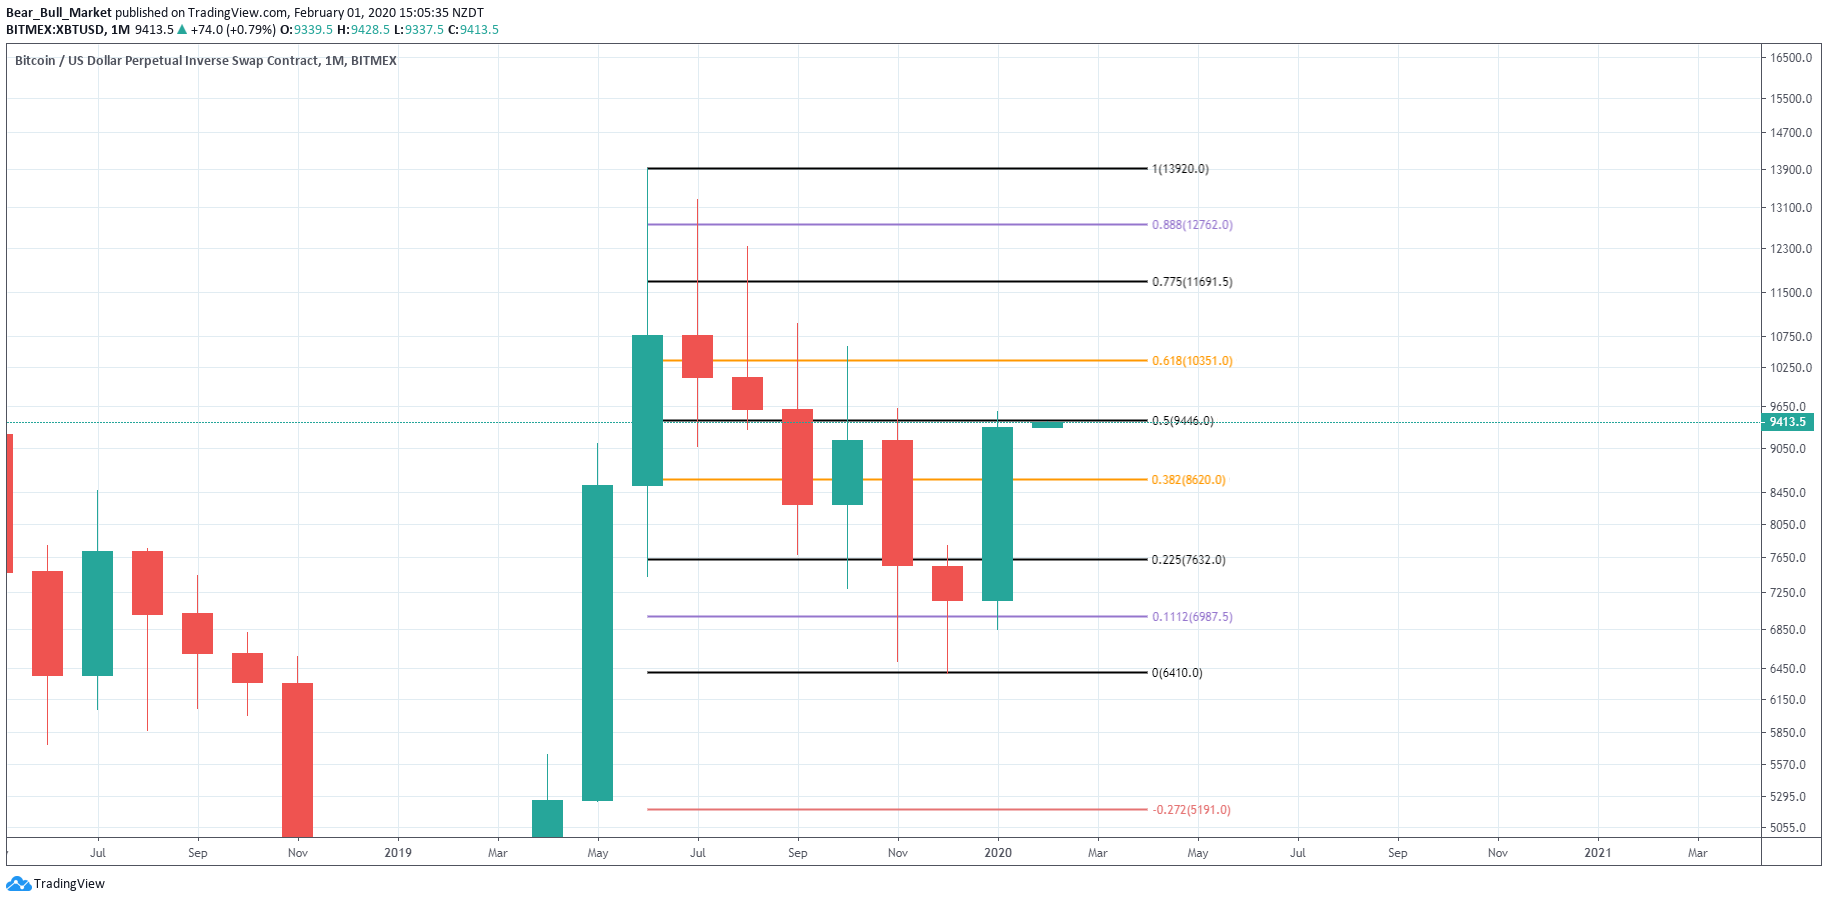
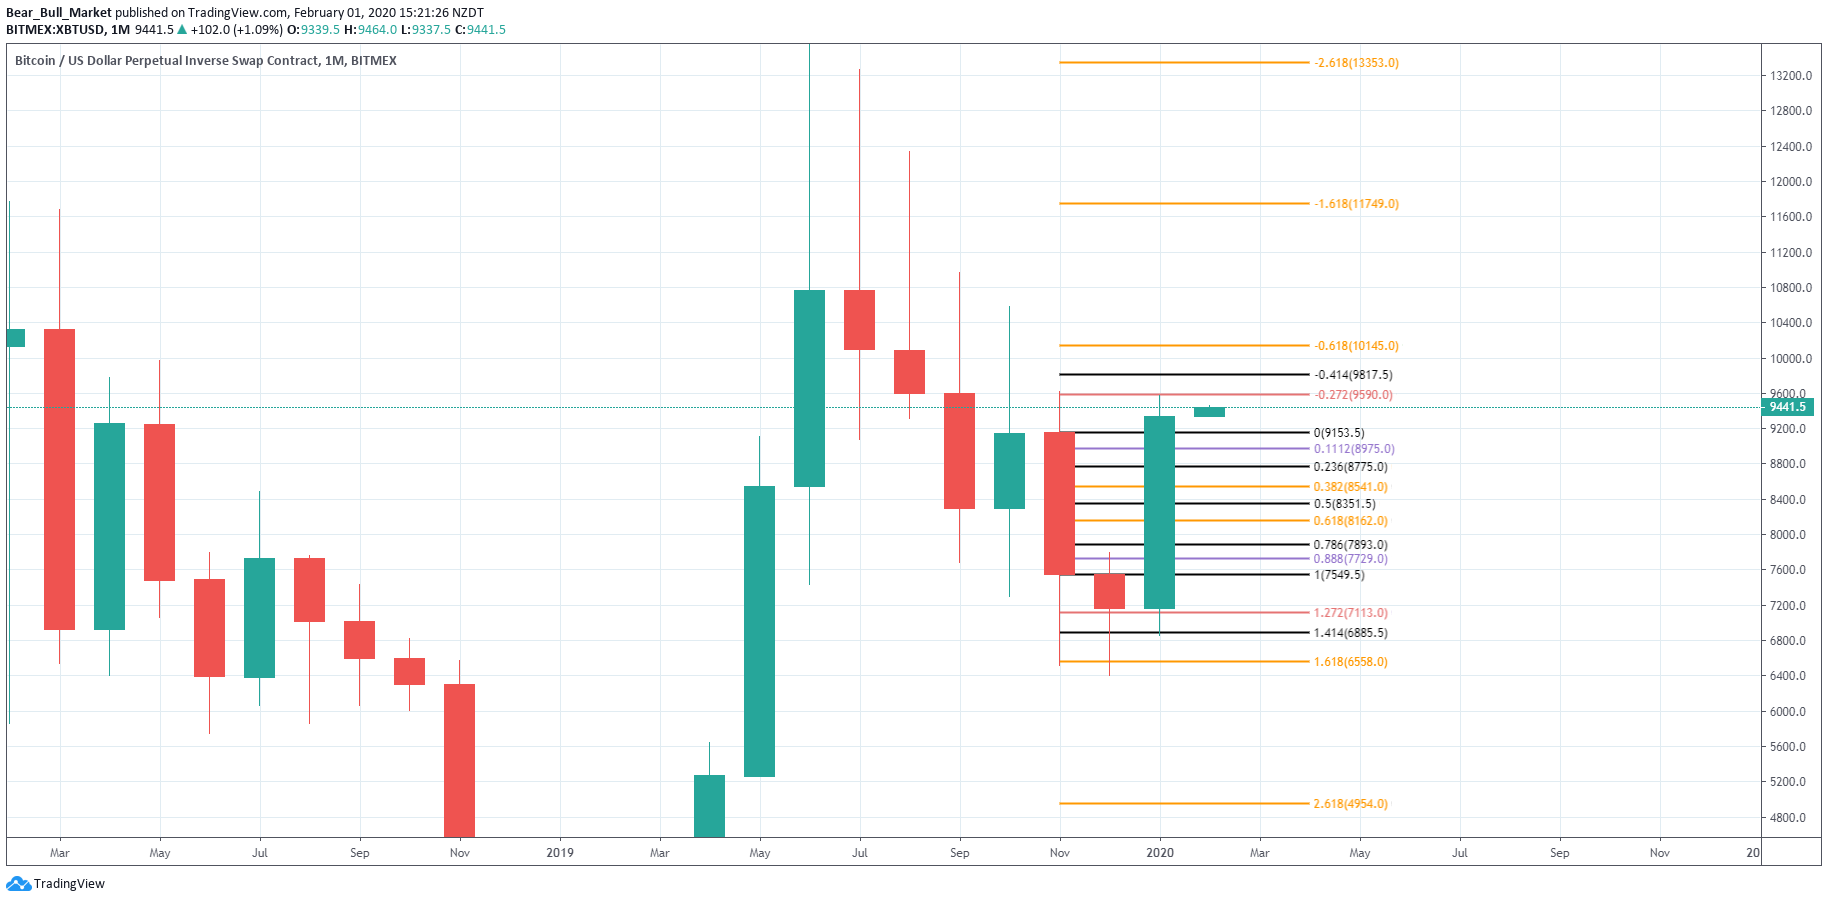
And then the Fib Retracement Tool from our current high, to our current low, shows that it would be likely to retrace back to $8,620 to retest the 0.382% Fib before moving forward trend. However, with the monthly close we’ve just had, I wouldn’t be surprised if that doesn’t happen and every dip is brought aggressively. But, if we do, favour $8,620.
View the Trading View Charts
Conclusion of Log Scale Fib Retracement Tool: Bullish :bull~1:
Looking at the Fib Retracement Tool in Linear scale, we see very different results, and we must consider them.
Looking at the Fib Retracement Tool from our ATH to the low of 2018-2019, we can see we rejected the 0.618% Fib and retraced back to the 0.786% Fib for a bounce back to the 0.618% Fib. Perfect trading, even within the chaotic news head lines we read. Show me the chart, and I’ll tell you the news.
View the Trading View Charts
We can now see from measuring from the 2018-2019 bottom, to the current high that we retraced back to the 0.618% Fib and launched, as expected. Claimed the 0.5% Fib in the process, However, we can see $9,795 is going to be a major resistance being the 0.382% Fib. If we do claim that as support, Our target from there is $20,594.
View the Trading View Charts
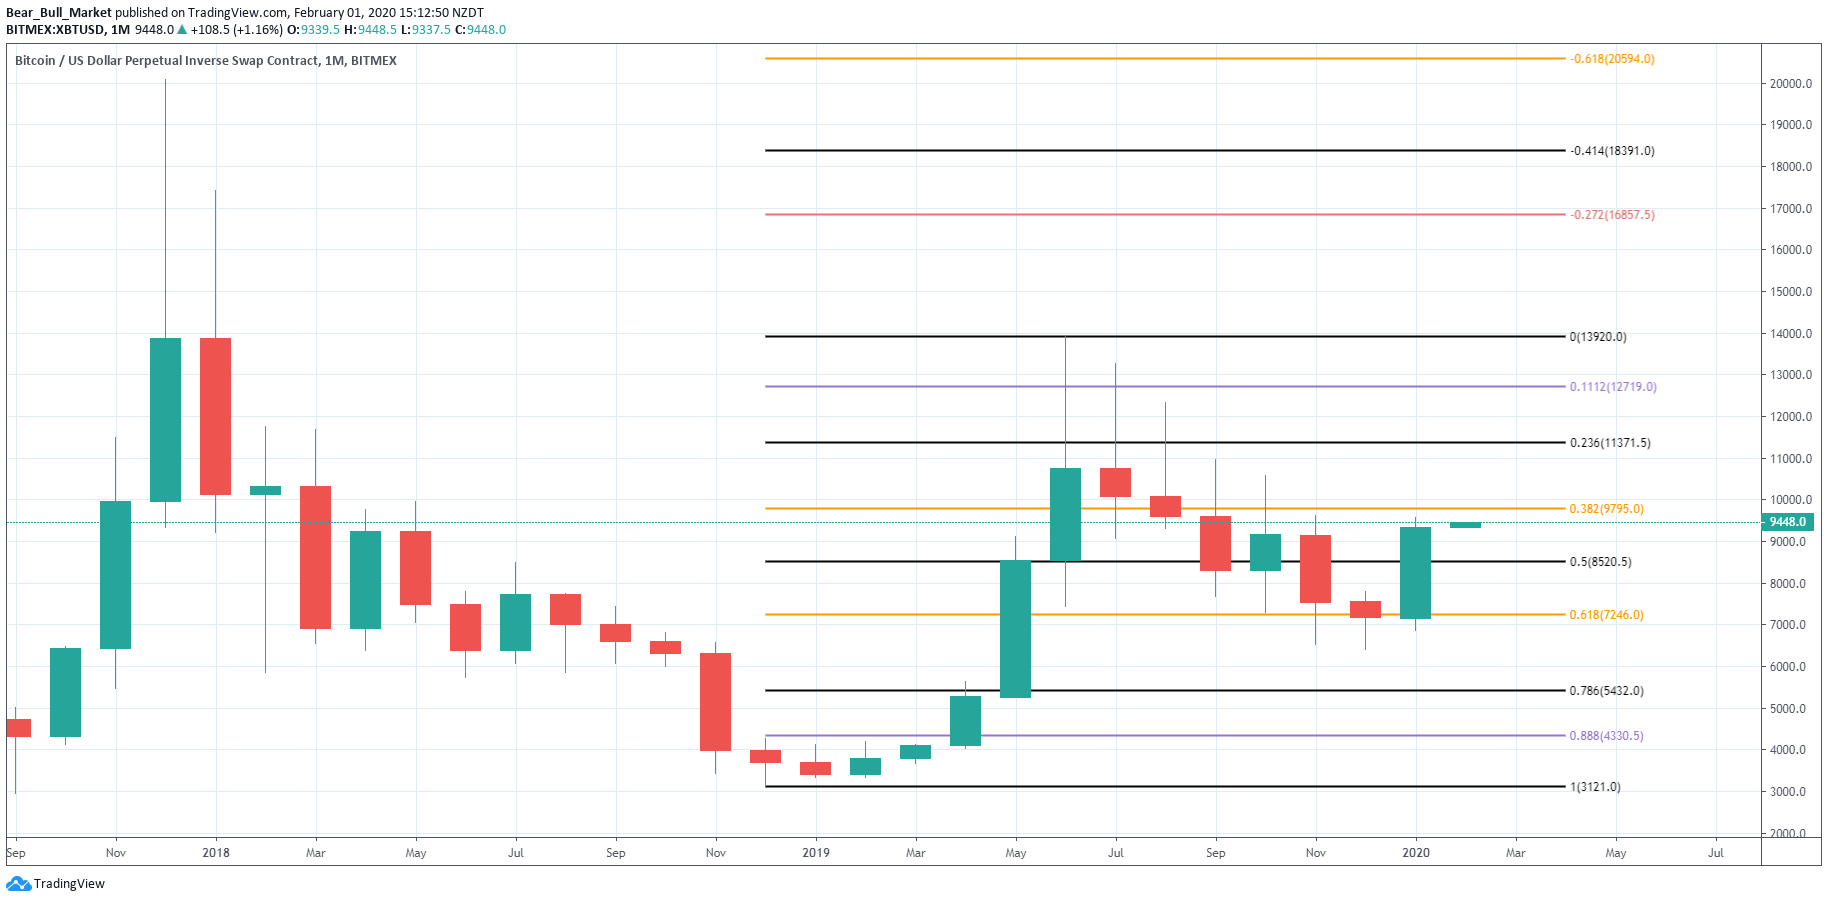
And then from our current top, to current low, we can see that we’ve closed nicely above the 0.382% which gives us resistance at $10,165 (0.5% Fib) and a target of $11,051 (0.618% Fib) if we’re able to hold $9,279.
View the Trading View Charts
Conclusion of Linear Scale Fib Retracement Tool: Bullish :bull~1: with major resistance right overhead, if claimed, we should continue up aggressively.
Candle Data is showing us that we’ve completed the pattern referred to as a Morning Star Reversal on the monthly, to achieve this we had to close 0.5% of the candle that lead us down. As we can see, we engulfed it completely, making this an extremely bullish close. We can also see by using the Fib Retracement Tool on the Bearish Candle that we also topped out exactly at it’s 0.127% Fib Extension.
View the Trading View Charts
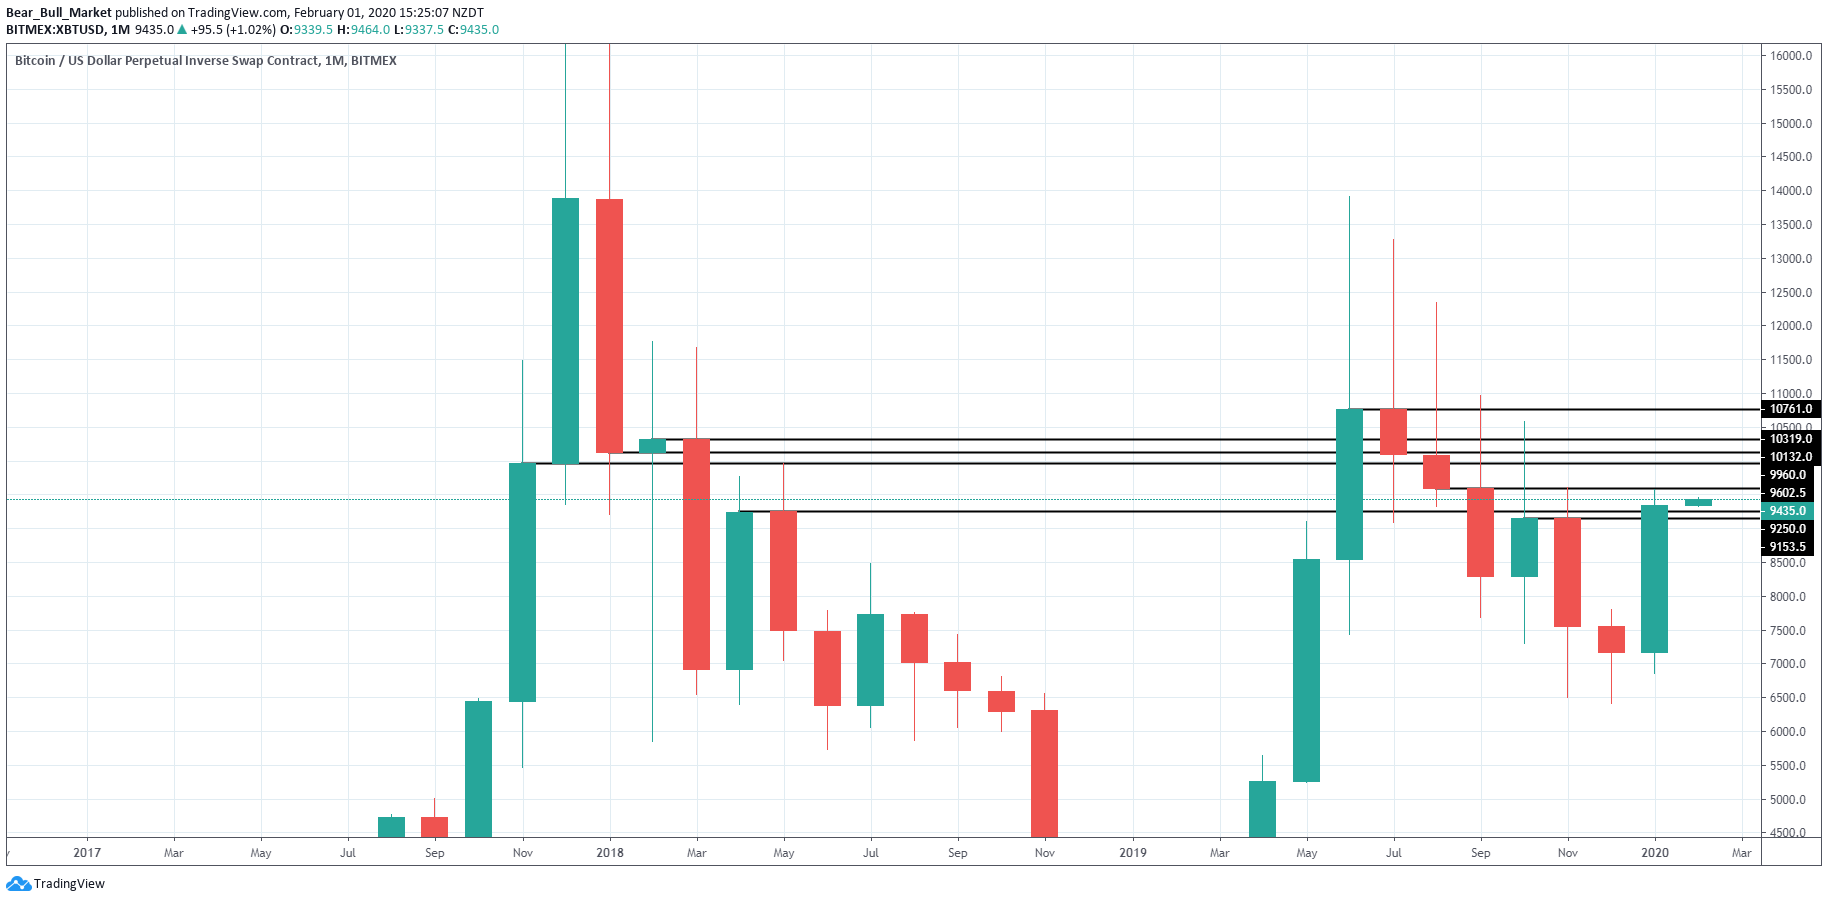
Monthly Candle Body closes of relevance:
Support:
$9,153
$9,250
Resistance:
$9,602
$10,132
$10,319
$10,761
View the Trading View Charts
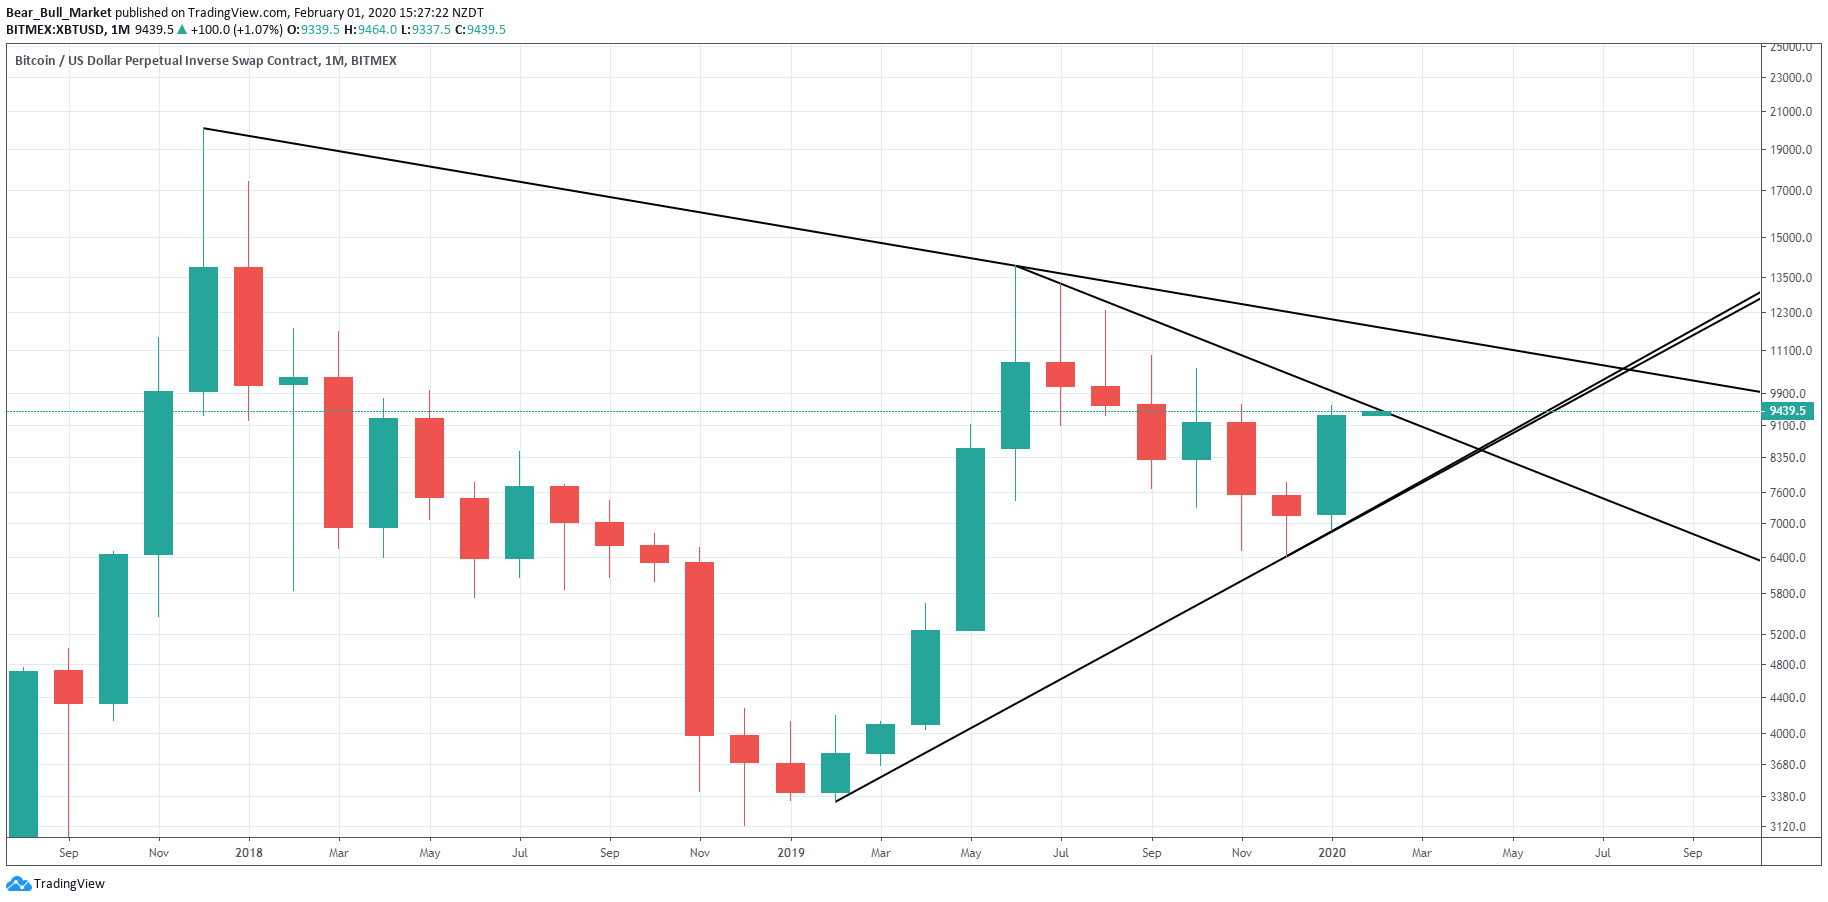
Linear Scale Trend Lines:
These are relevant, it is worth marking them on your chart. They just indicate where price WILL find resistance.
View the Trading View Charts
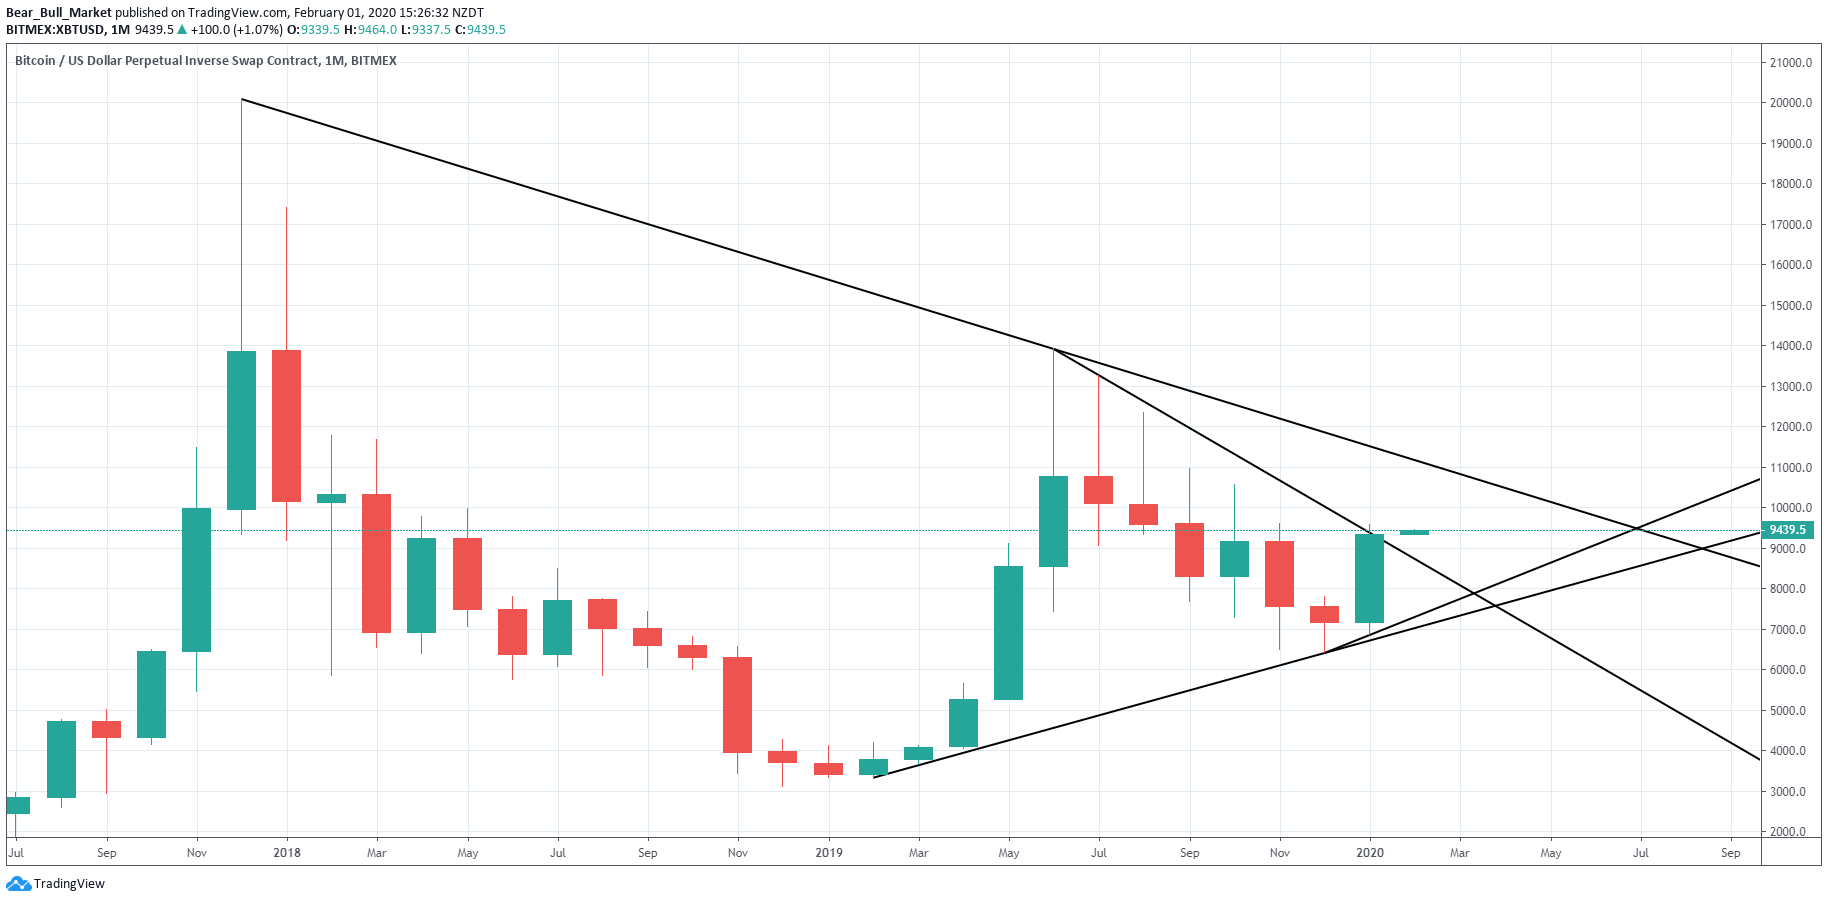
Log Scale Trend Lines:
These are relevant, it is worth marking them on your chart. They just indicate where price WILL find resistance.
View the Trading View Charts
Example: Current Log Scale Monthly Chart‘s trend lines show us we’re at resistance now, zooming in ~ we can see the effect.
View the Trading View Charts
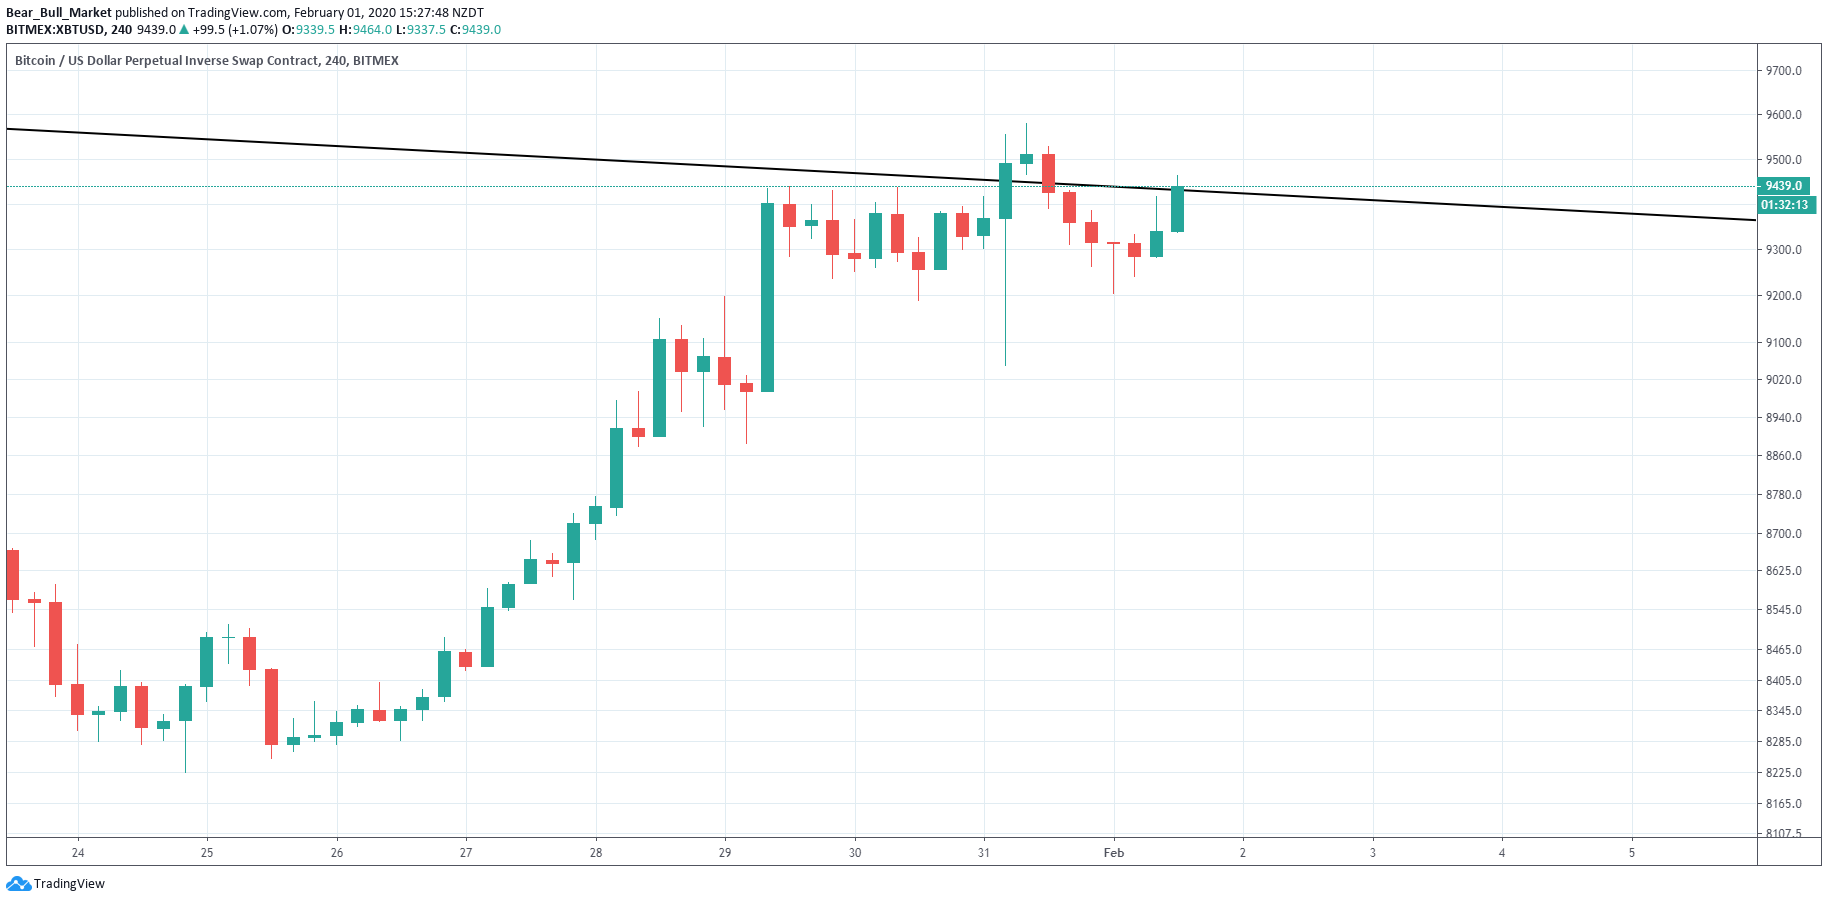
View the Trading View Charts
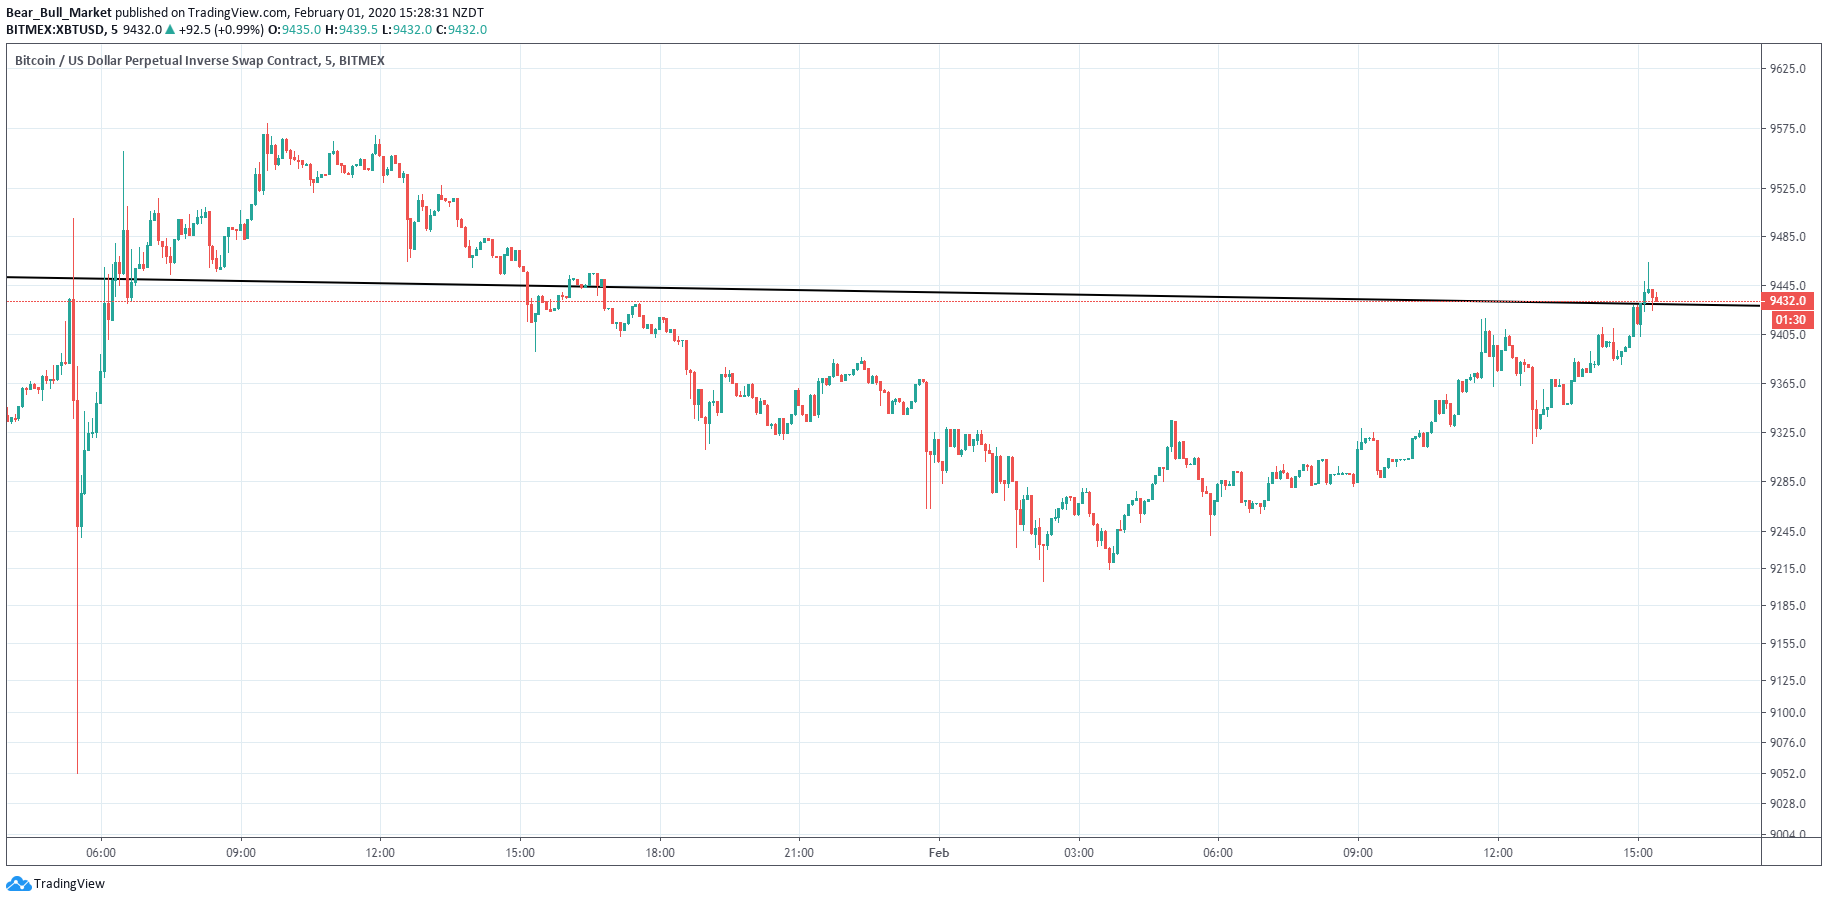
Conclusion:Log and Linear Scale Trend Lines show that we’re currently at resistance, closed under it by default and are currently Dancing around it. Pay attention to these lines. They show NO bias of direction though.
Indicators:
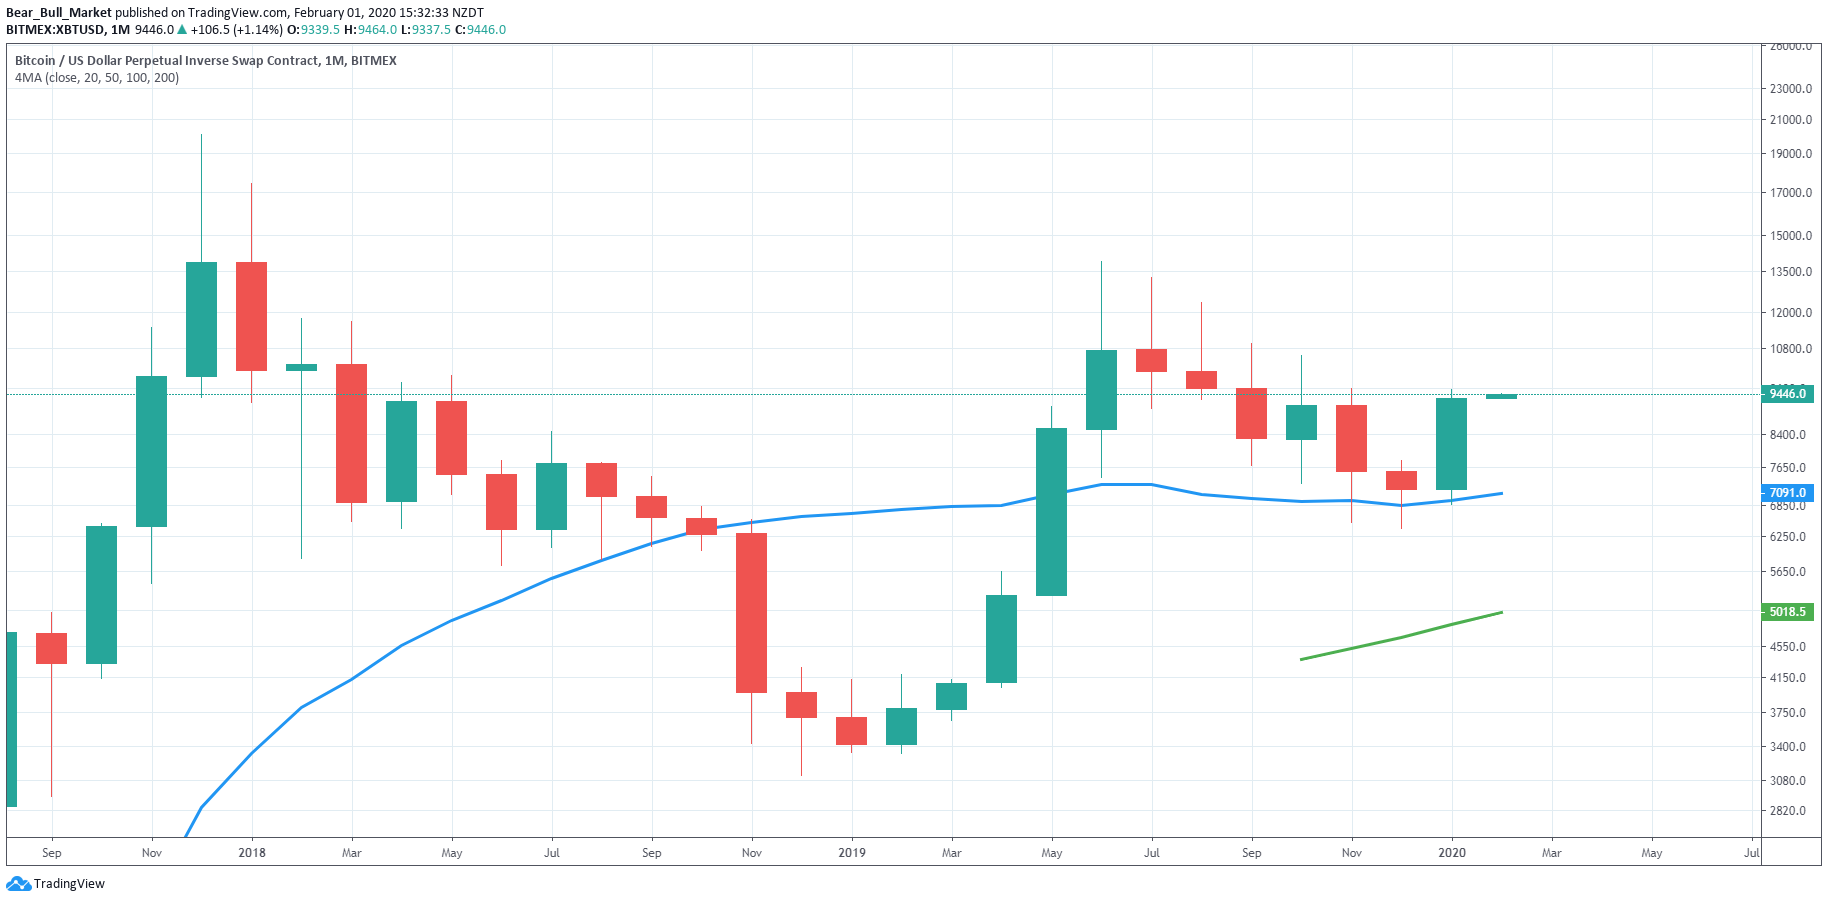
20 Moving Average has held as support. Bullish.
View the Trading View Charts
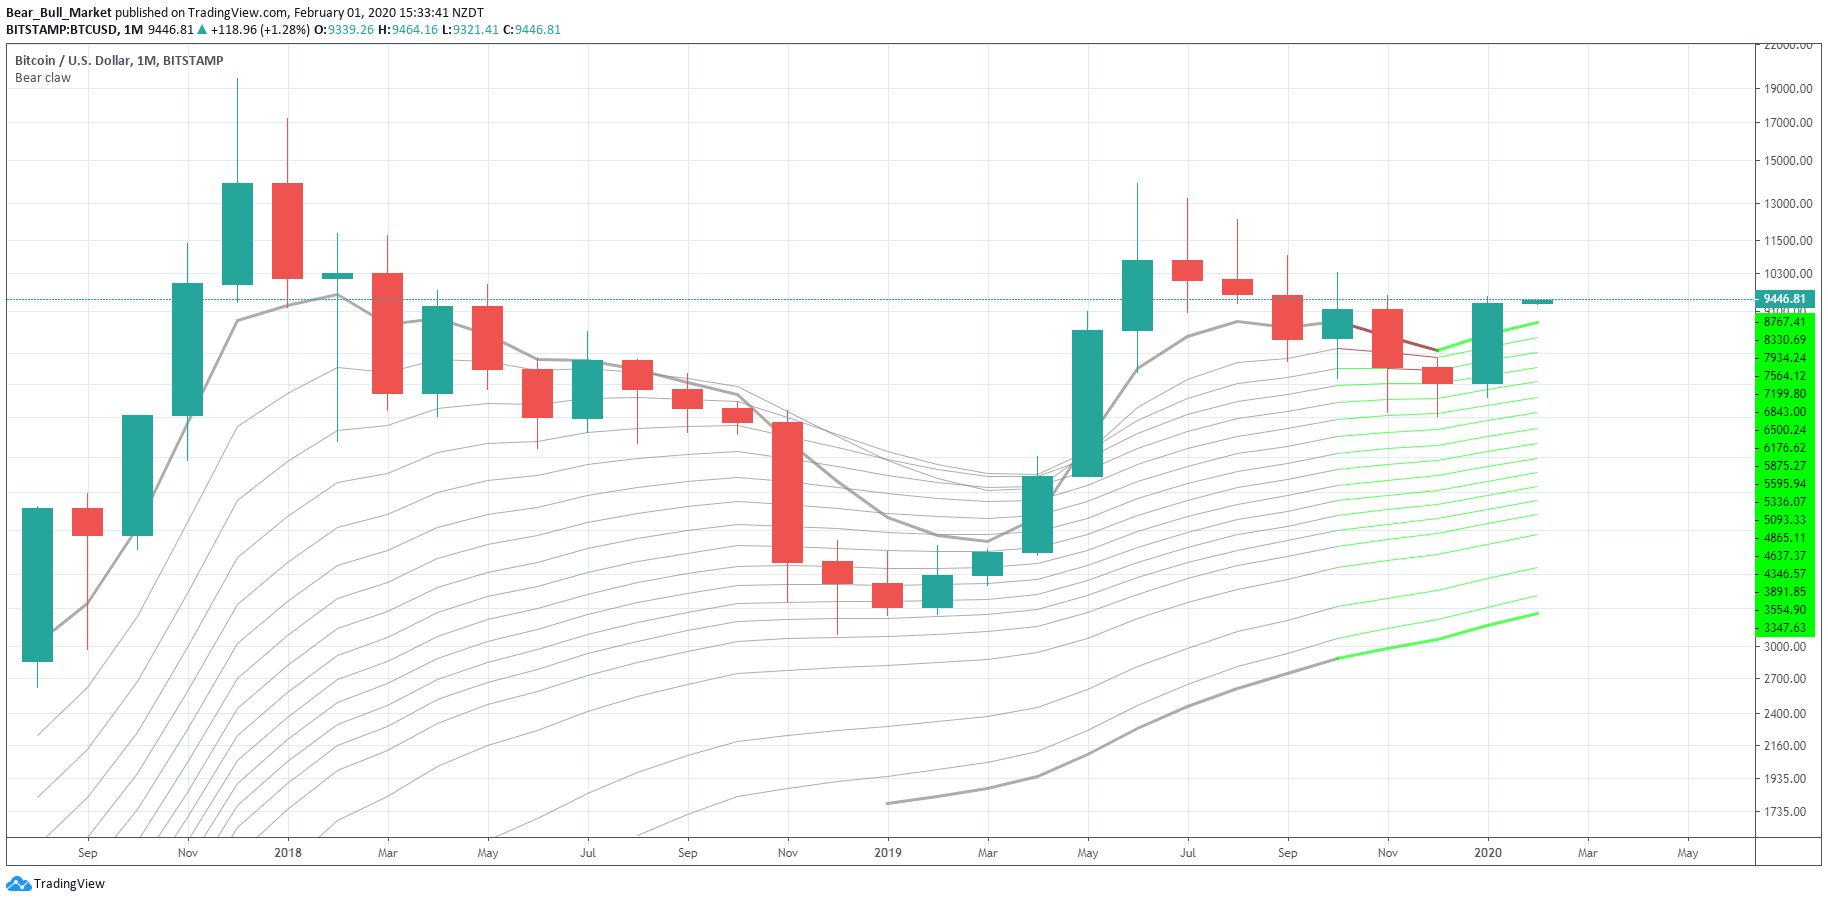
Bear Claw we’ve closed above. Bullish.
View the Trading View Charts
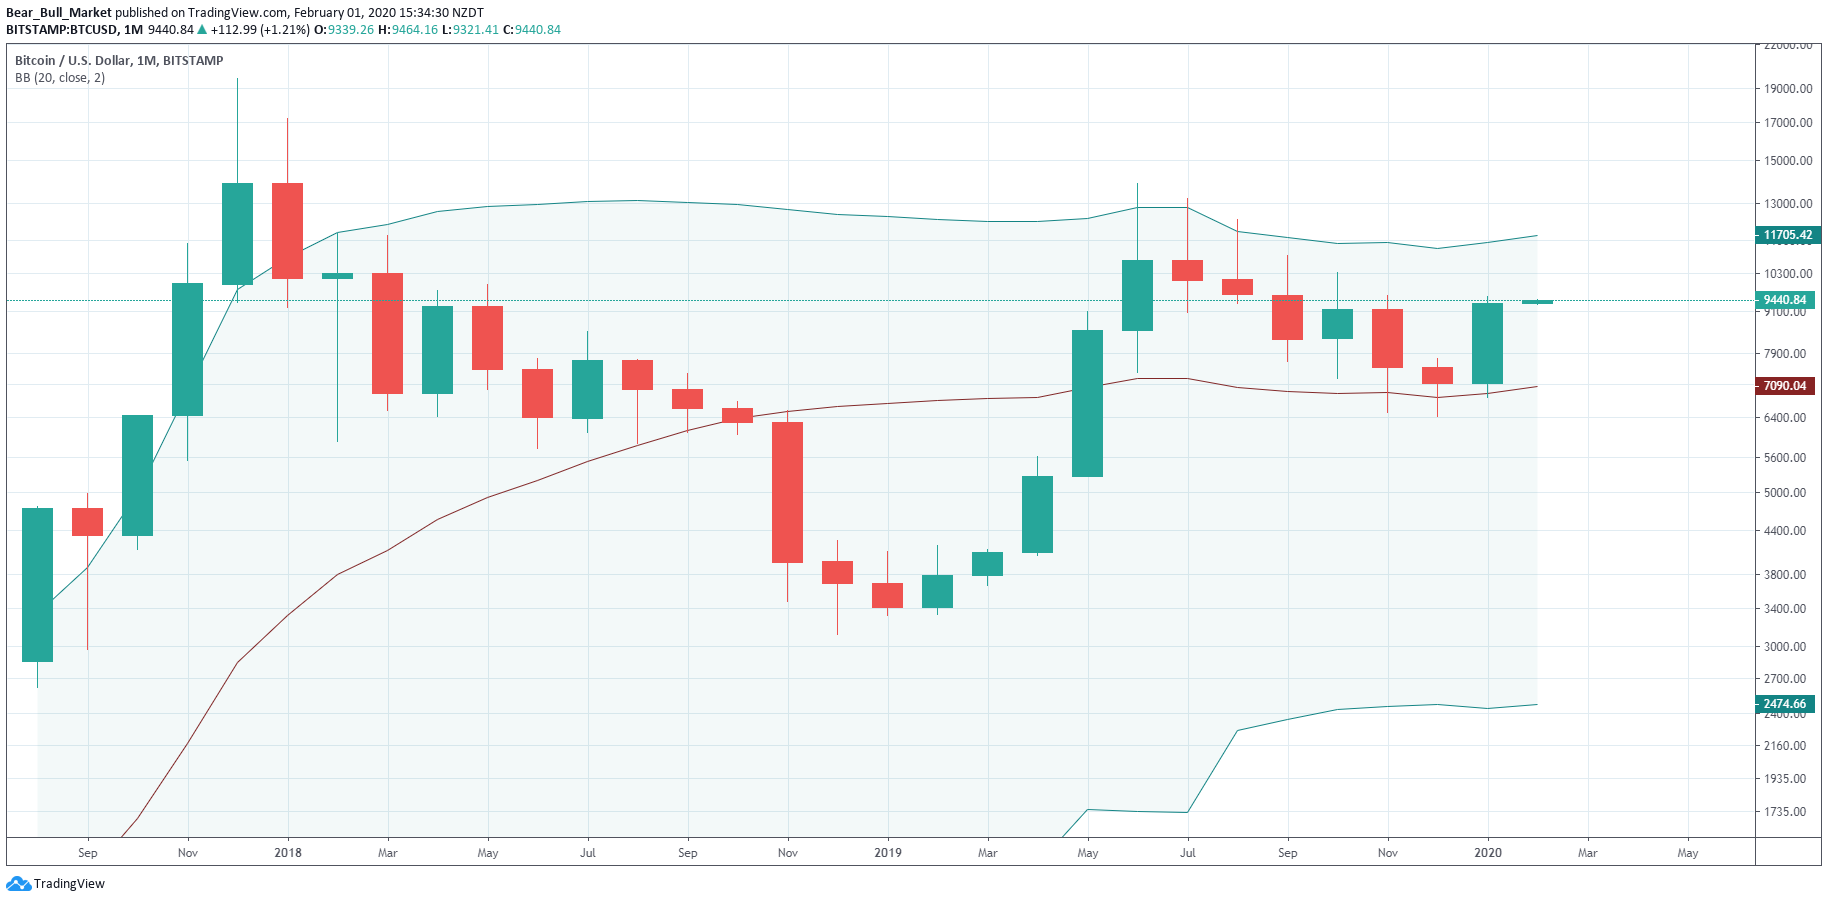
Bollinger Bands We’ve held support and bounced. Very Bullish.
View the Trading View Charts
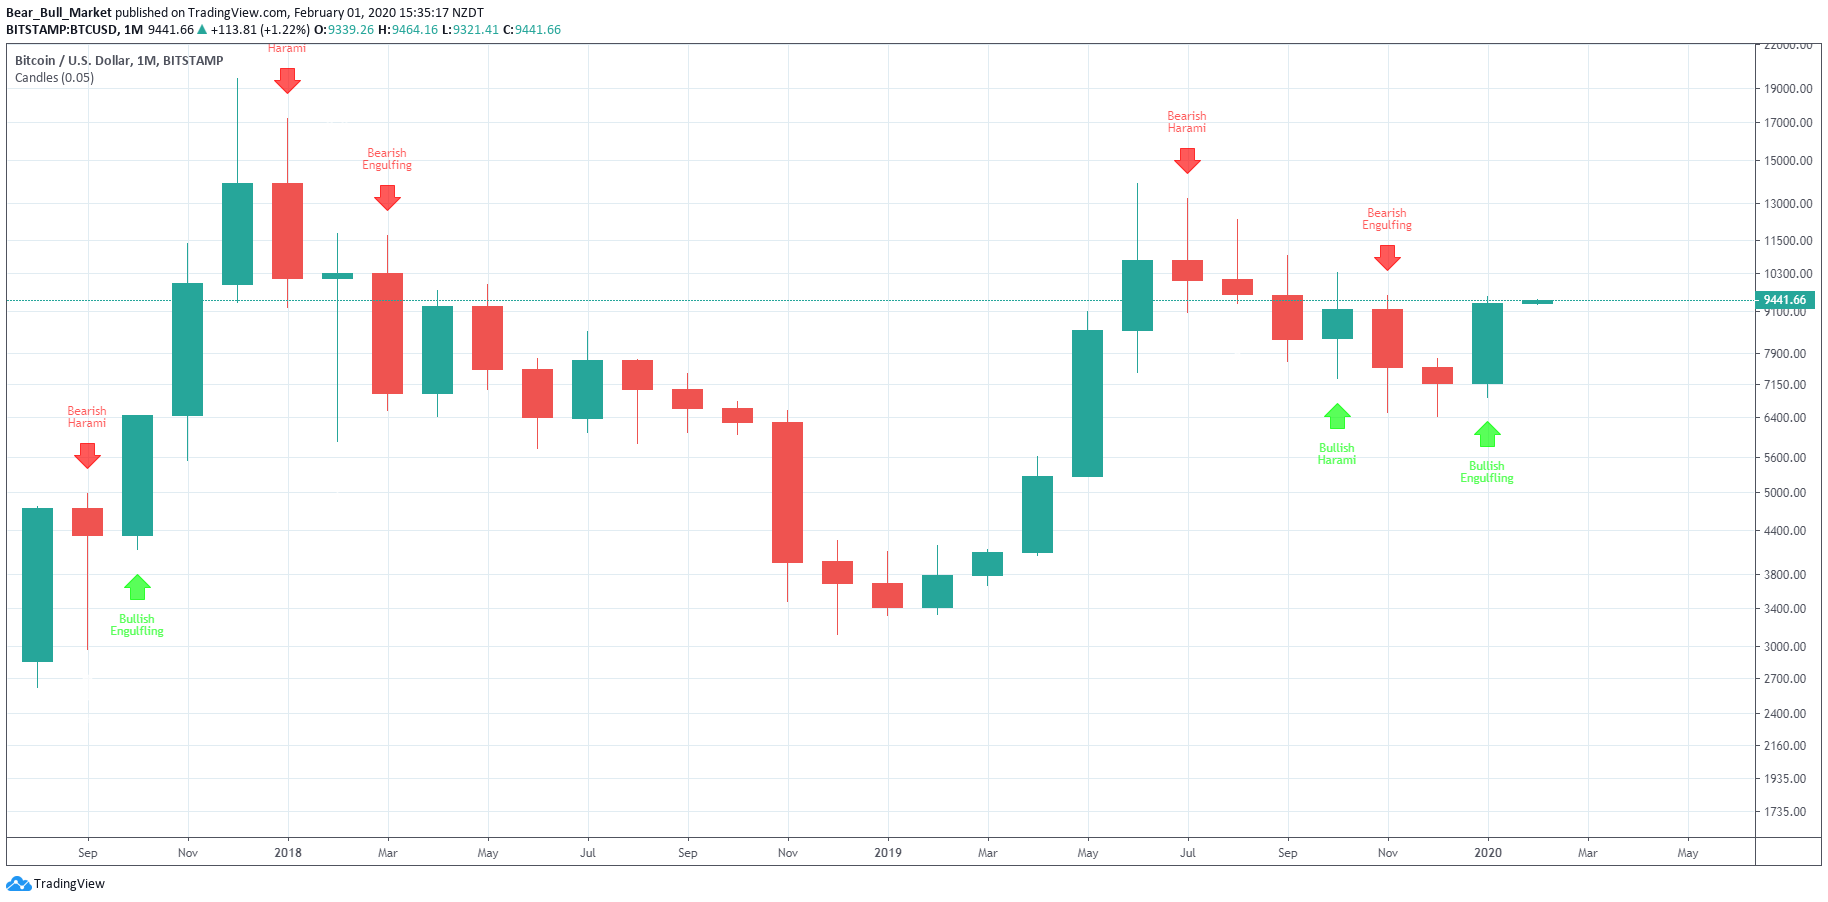
Candles as earlier stated, Bullish Engulfing. Bullish.
View the Trading View Charts
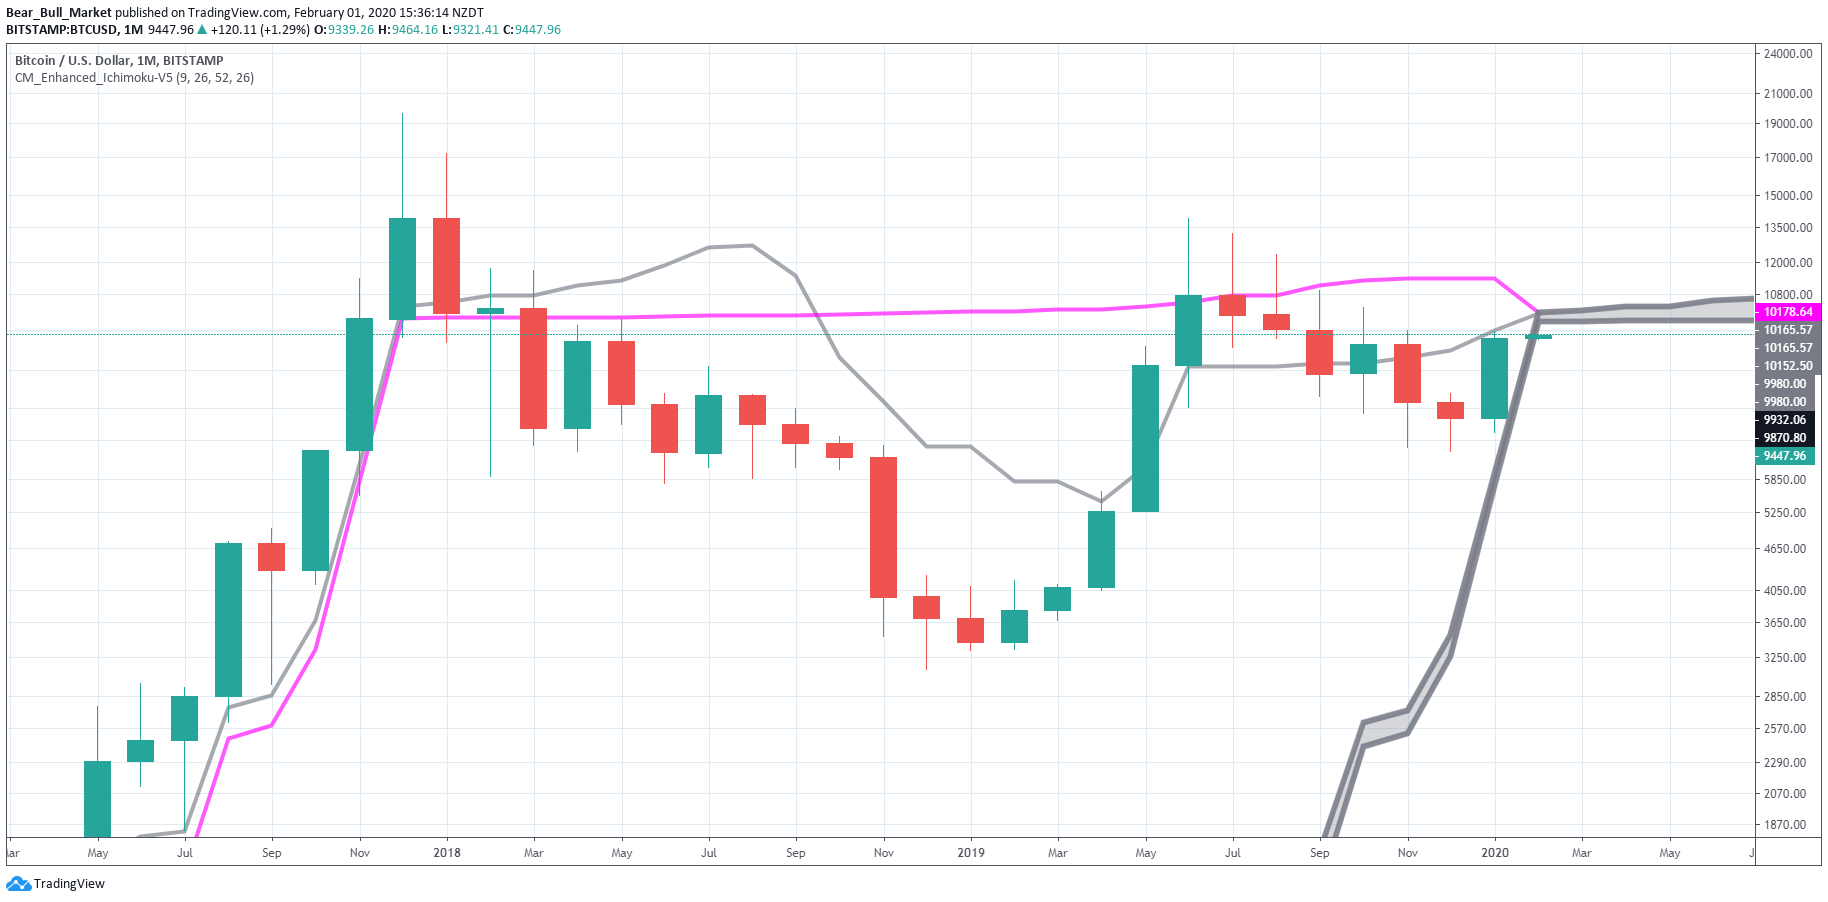
Ichimoku is showing us at a very interesting spot. We’ve bounced nicely off the monthly KUMO cloud. and have a TK cross this month. The last time we had a bullish TK cross, was the bottom of 2015. Be excited, I am. Bullish.
View the Trading View Charts
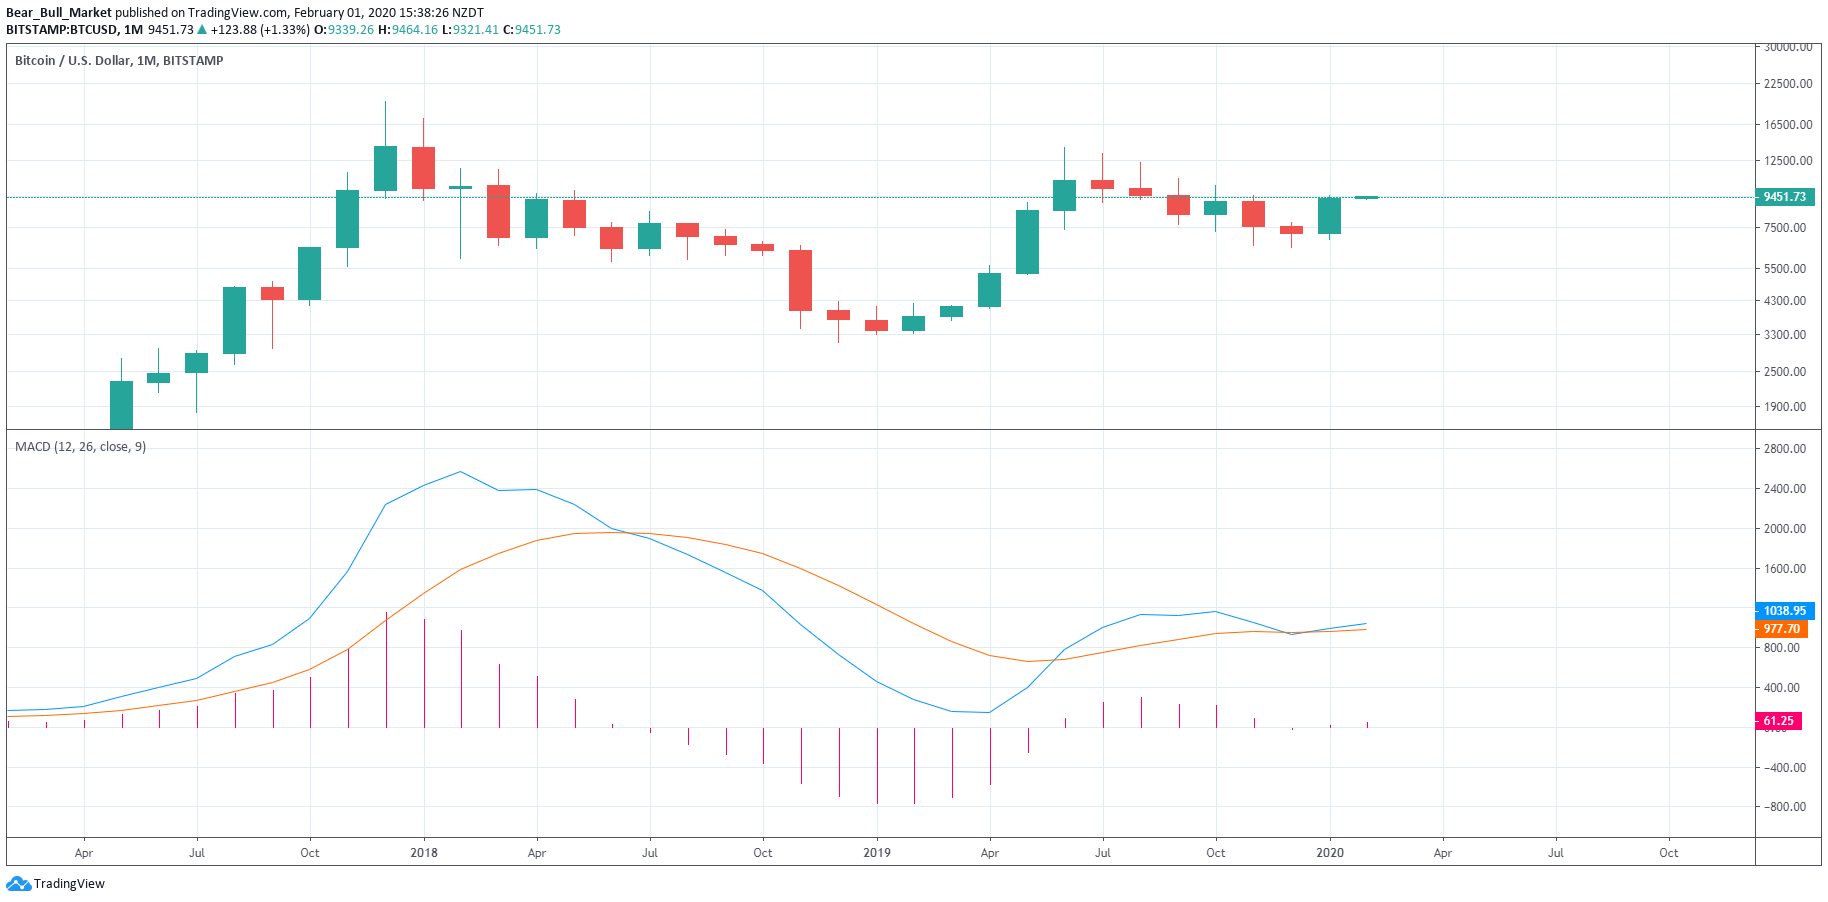
MACD has crossed, and is starting to open up, showing momentum. Bullish.
View the Trading View Charts
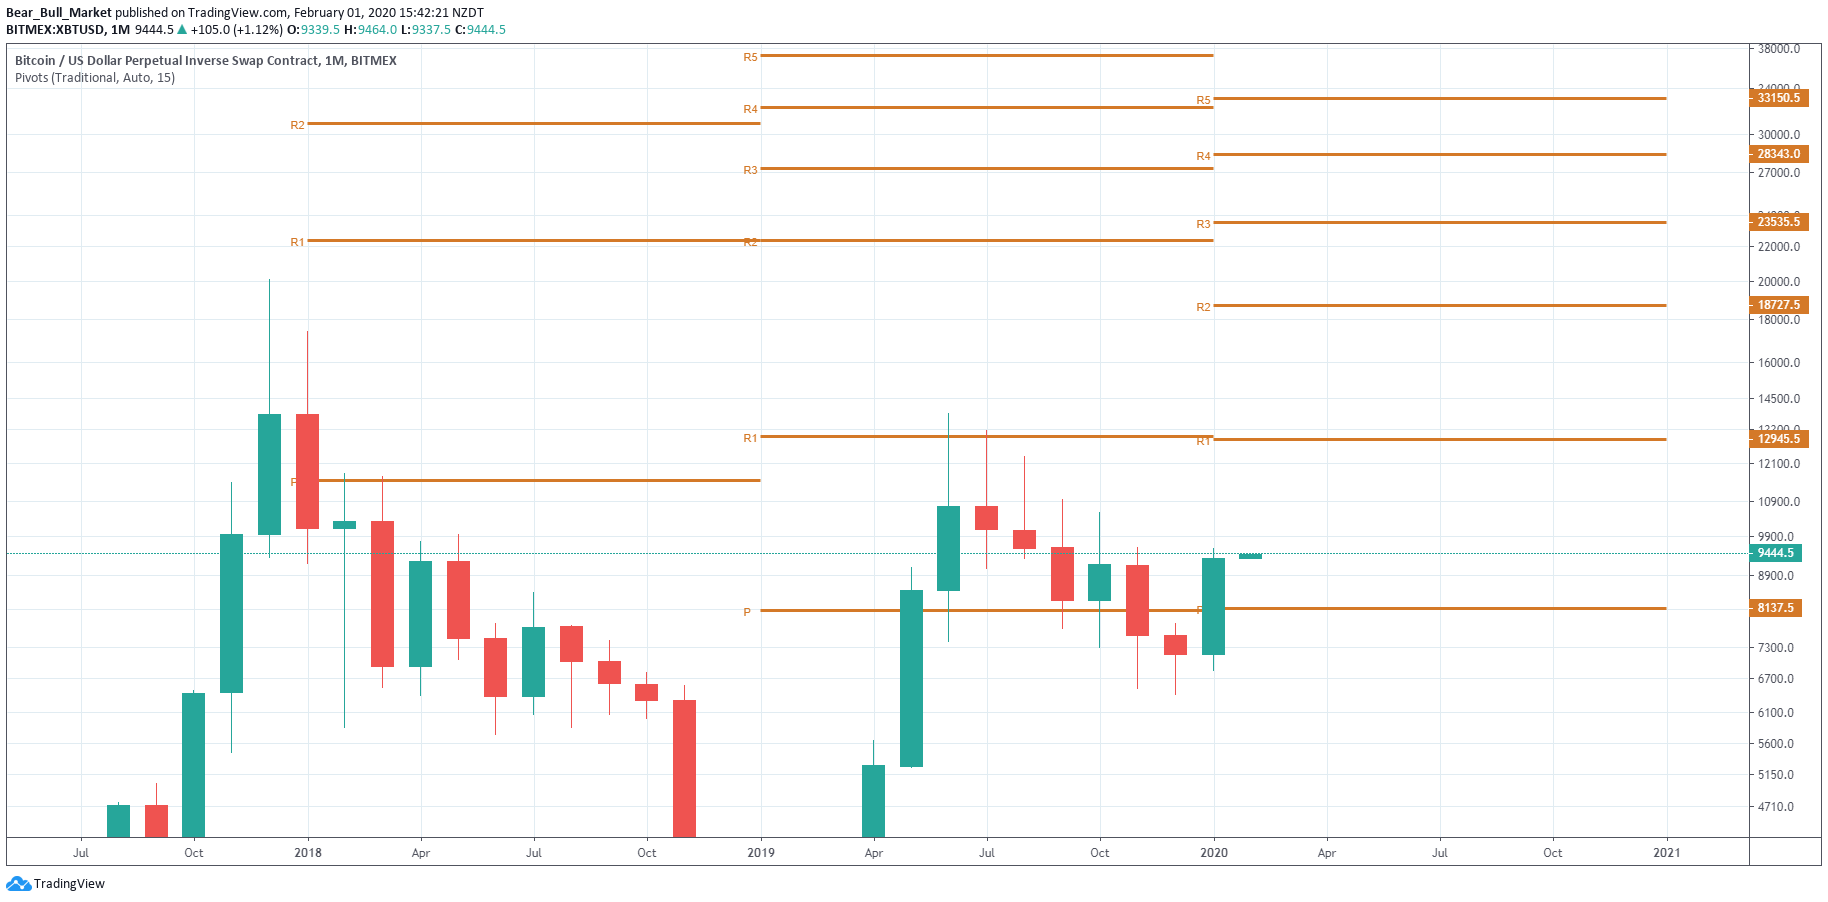
Pivots Traditional show us that we’ve reclaimed the Pivot level with aggression, that 8,137.5 is now a major Support and moving forward our target is R1 with a price of $12,945.5 followed by $18,727.5. Bullish.
View the Trading View Charts
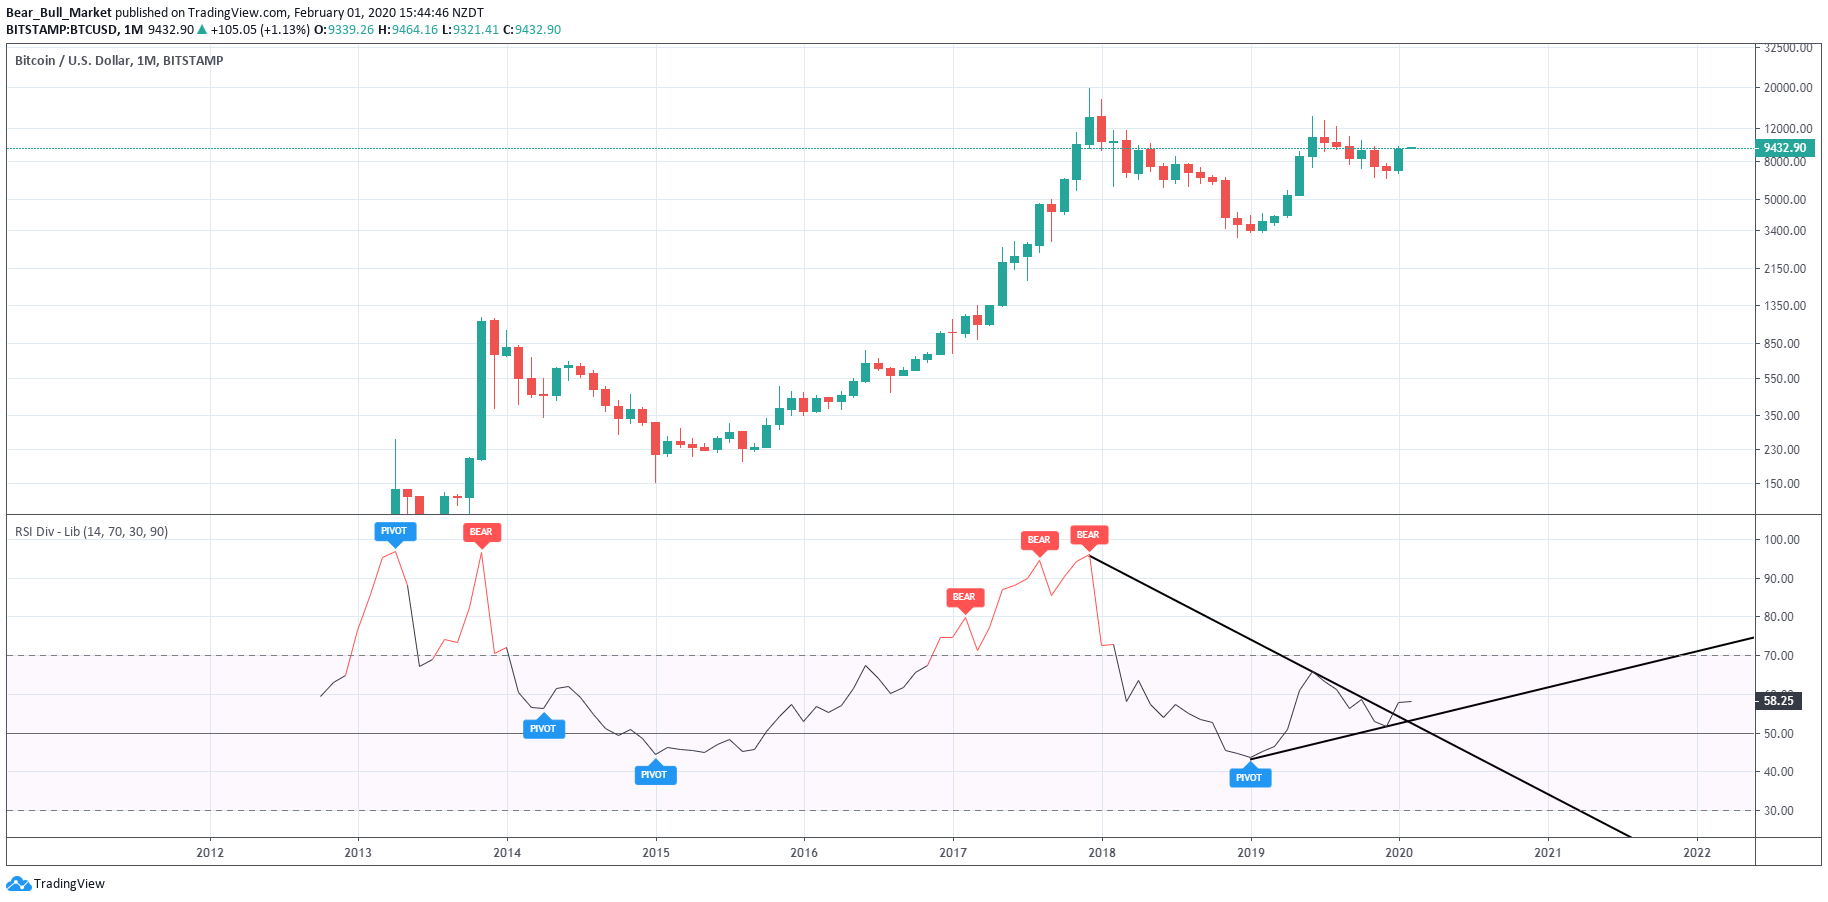
RSI is showing us we’re bullish. Holding above 50 while also breaking resistance. Bullish.
View the Trading View Charts
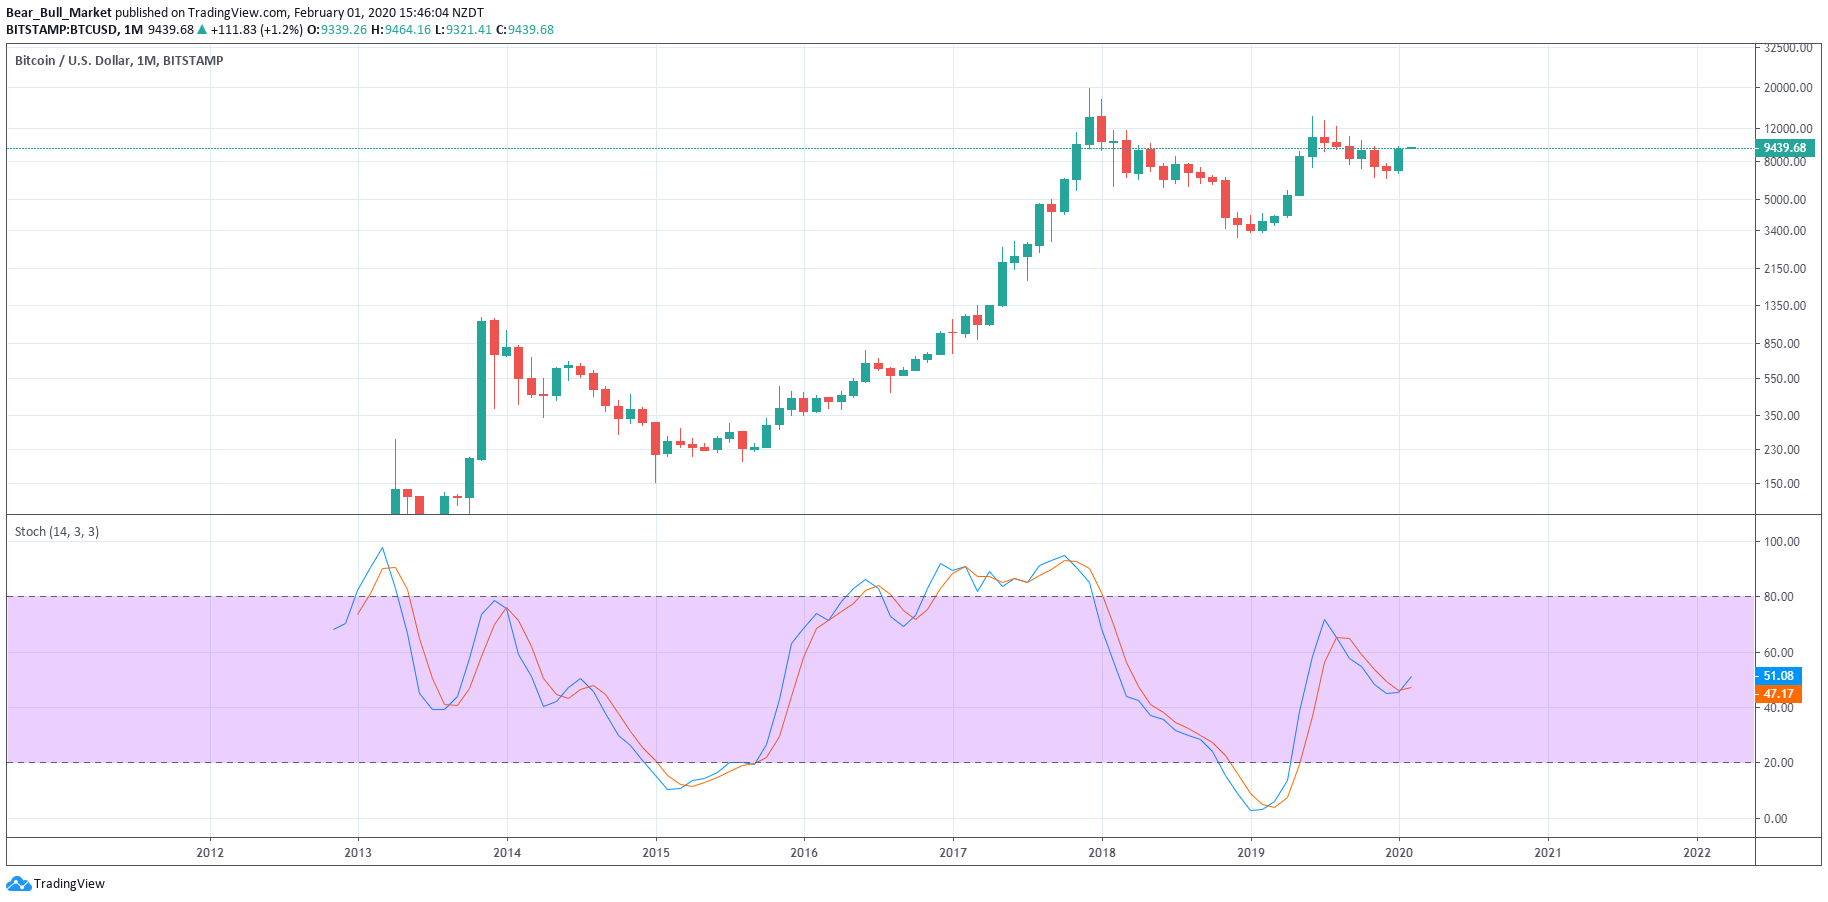
Stoch shows we’ve just crossed, and momentum should be to the upside now. However looking at our previous market cycles, we’re not in the clear yet. Neutral.
View the Trading View Charts
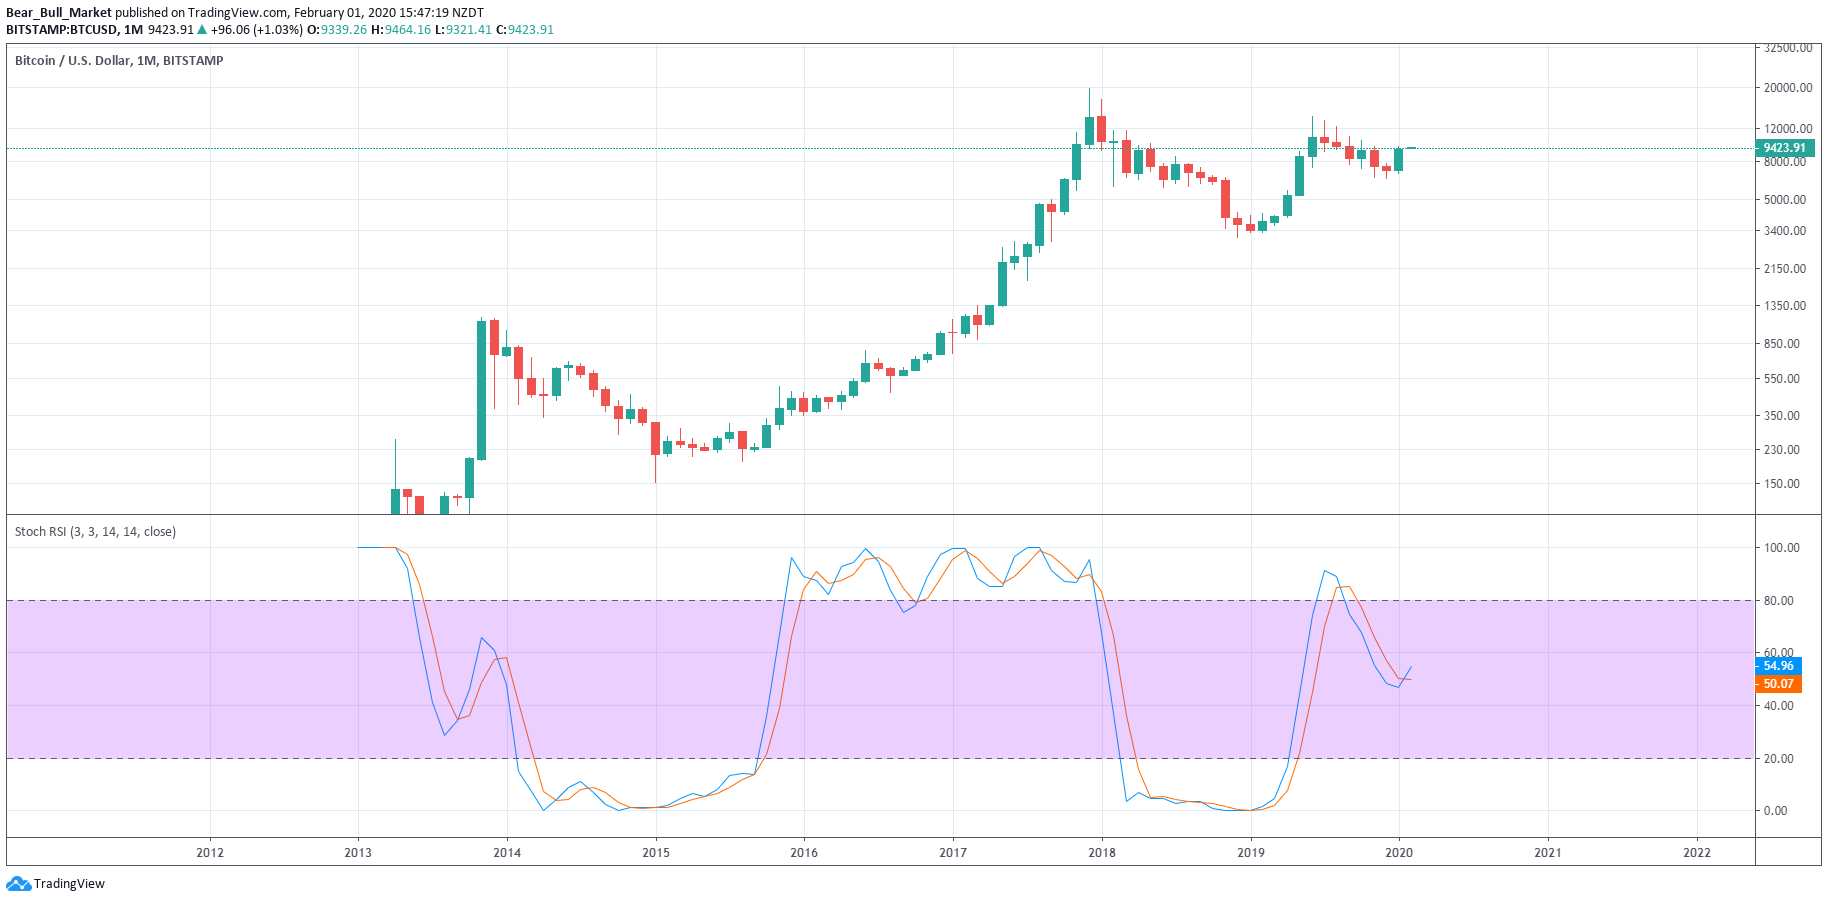
Stoch RSI shows we’ve just crossed also, and momentum should be to the upside now. However, also look at our previous market cycles, we’re not in the clear yet. Neutral.
View the Trading View Charts
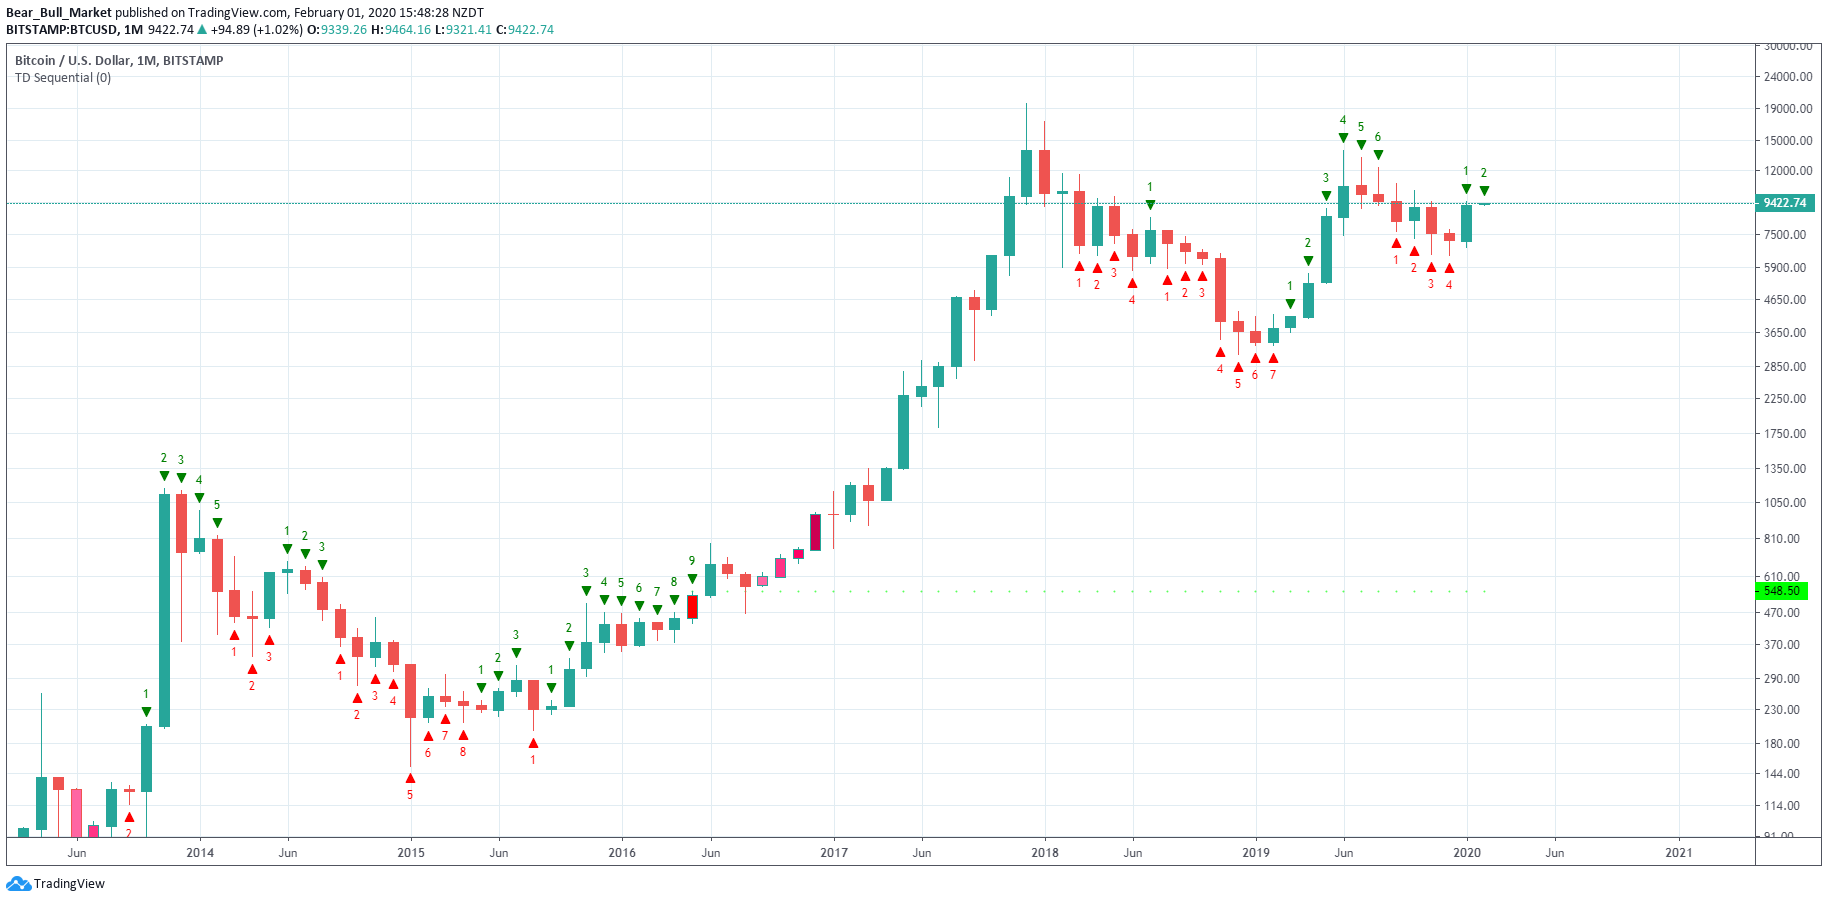
TD Sequential shows us we may be starting a new cycle, a clear and clean 1. Bullish.
View the Trading View Charts
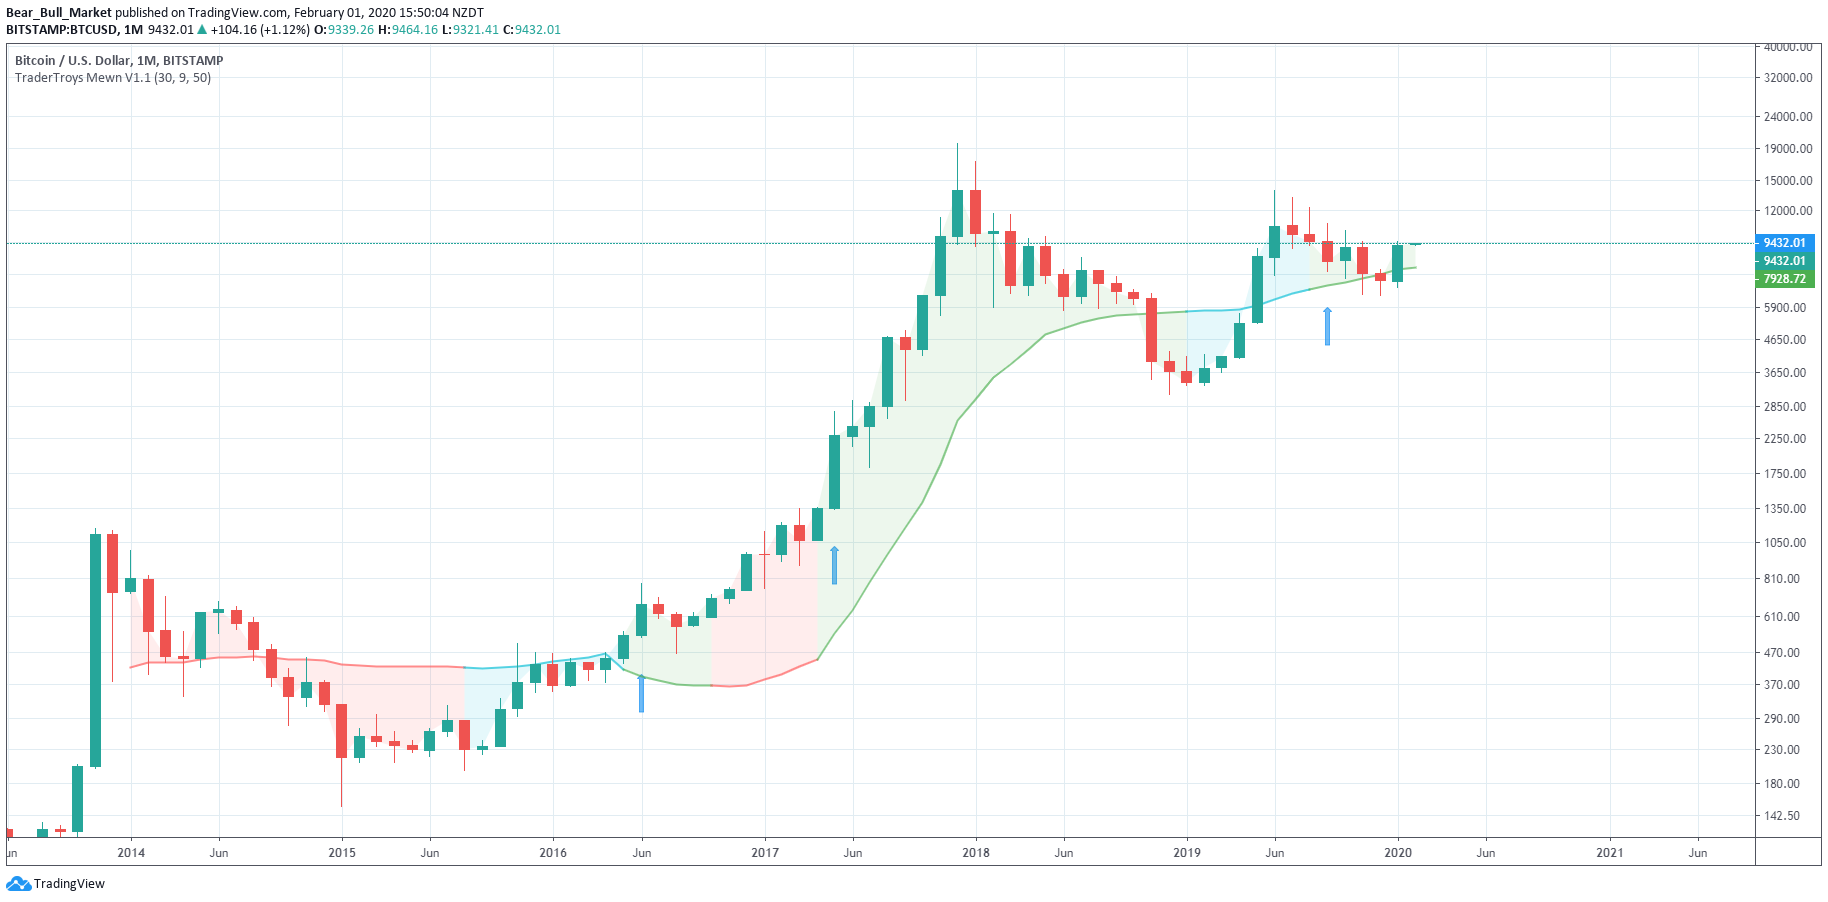
Trader Troy’s Moon Indicator is green!! Doesn’t go green often. And we’ve reclaimed the critical level mapped. Extremely Bullish!!
View the Trading View Charts
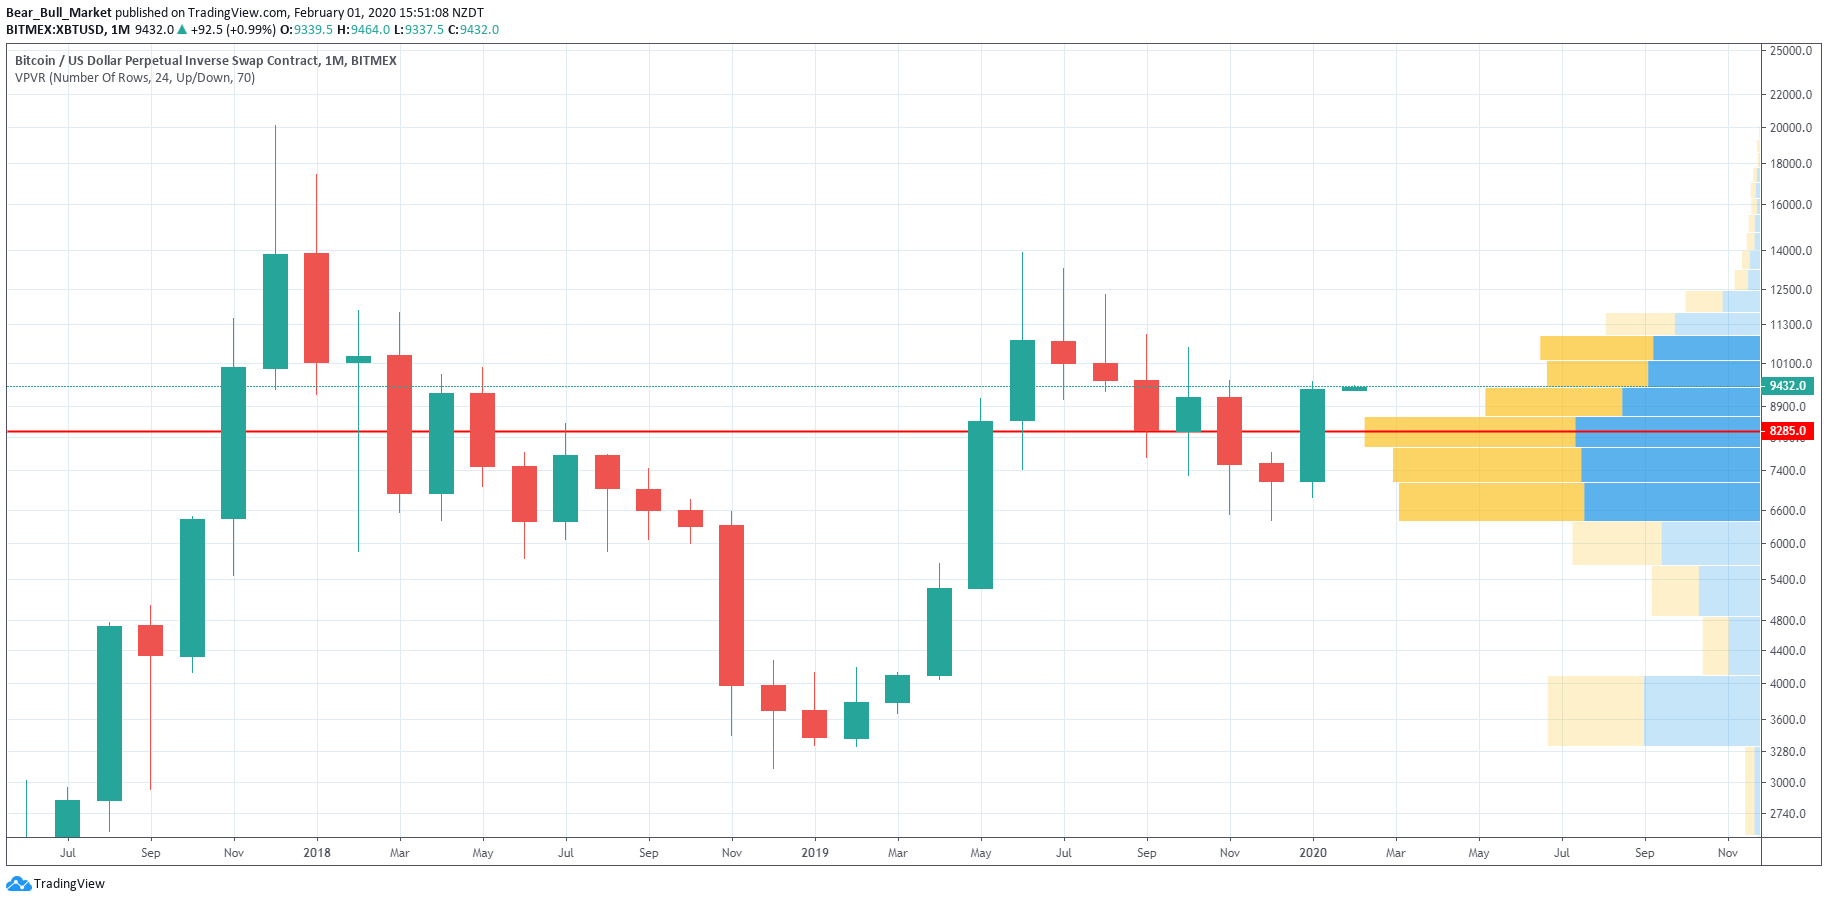
VPVR shows us we’re now above the high volume level nodes, and that the trip back to 14,000 and then $20,000 should be a walk in the park.
View the Trading View Charts
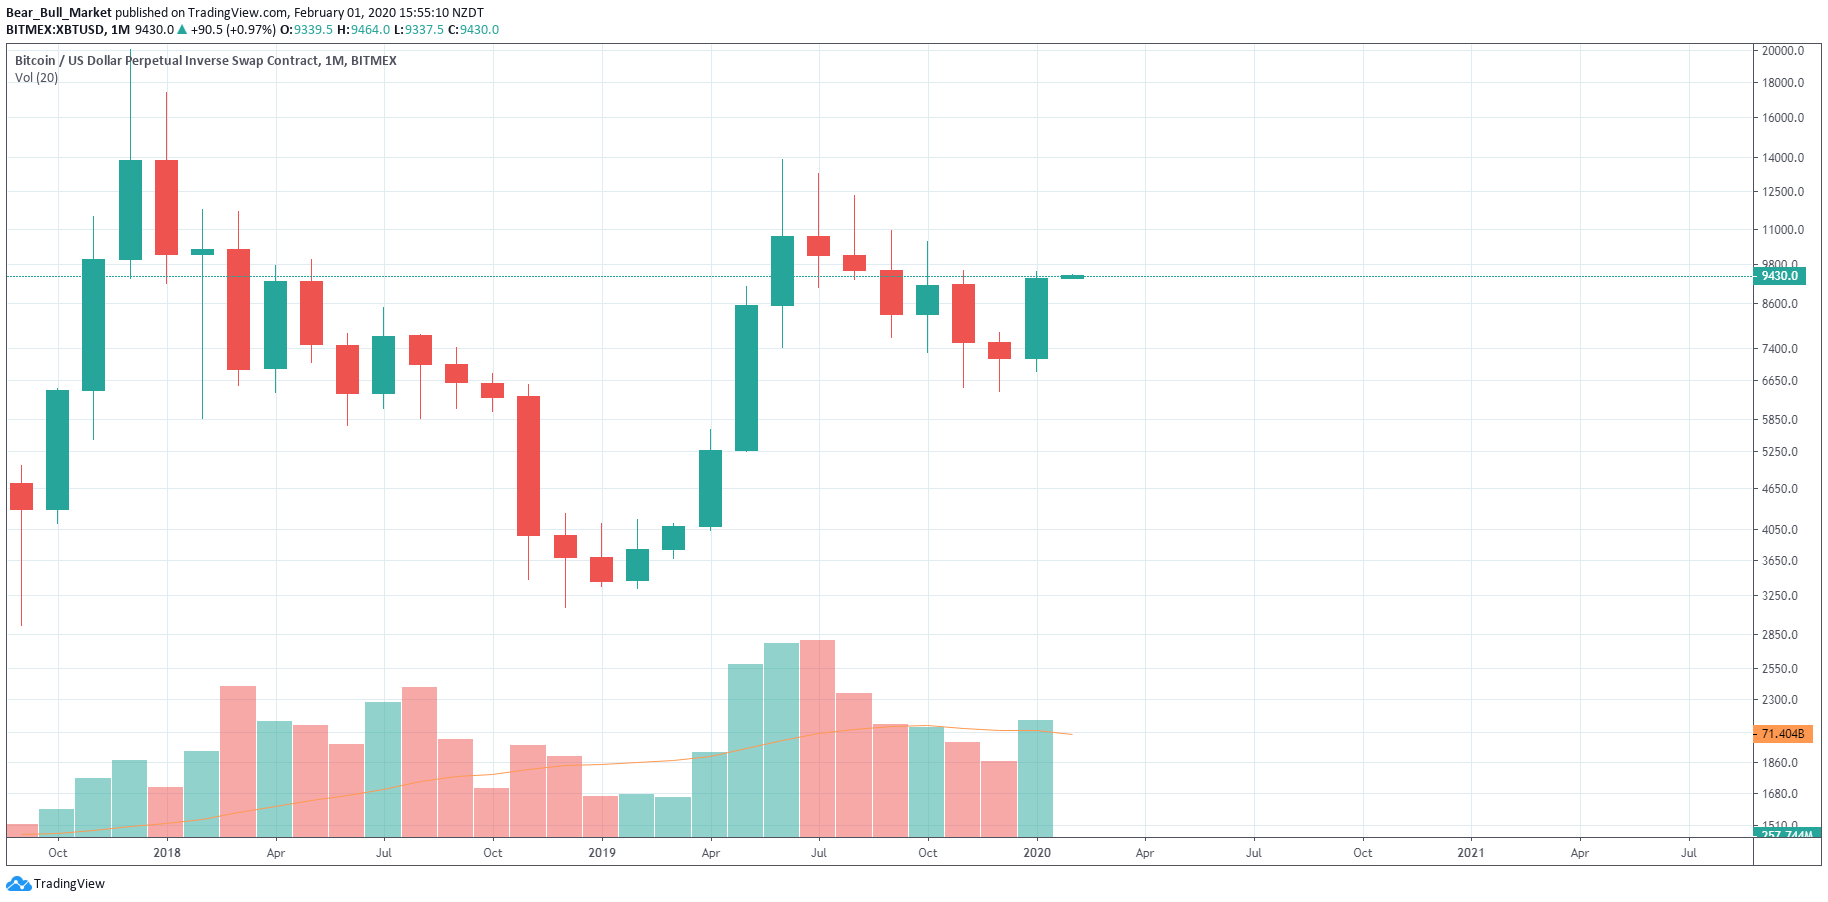
Volume shows us that we’re on the right track. More volume in January than the 3 months leading out of the bottom of 2014-2015. It shows us people don’t want to miss out this time. I would expect Februarys volume to be massive, with massive upside price action.
View the Trading View Charts
Indicators are showing that we are very Bullish! but to keep an eye on STOCH and STOCH RSI.
TL:DR of Monthly Analysis
Conclusion of Log Scale Fib Retracement Tool: Bullish
Conclusion of Linear Scale Fib Retracement Tool: Bullish with major resistance right overhead, if claimed, we should continue up aggressively.
Conclusion:Log and Linear Scale Trend Lines show that we’re currently at resistance, closed under it by default and are currently Dancing around it. Pay attention to these lines. They show NO bias of direction though.
Indicators are showing that we are very Bullish! but to keep an eye on STOCH and STOCH RSI.
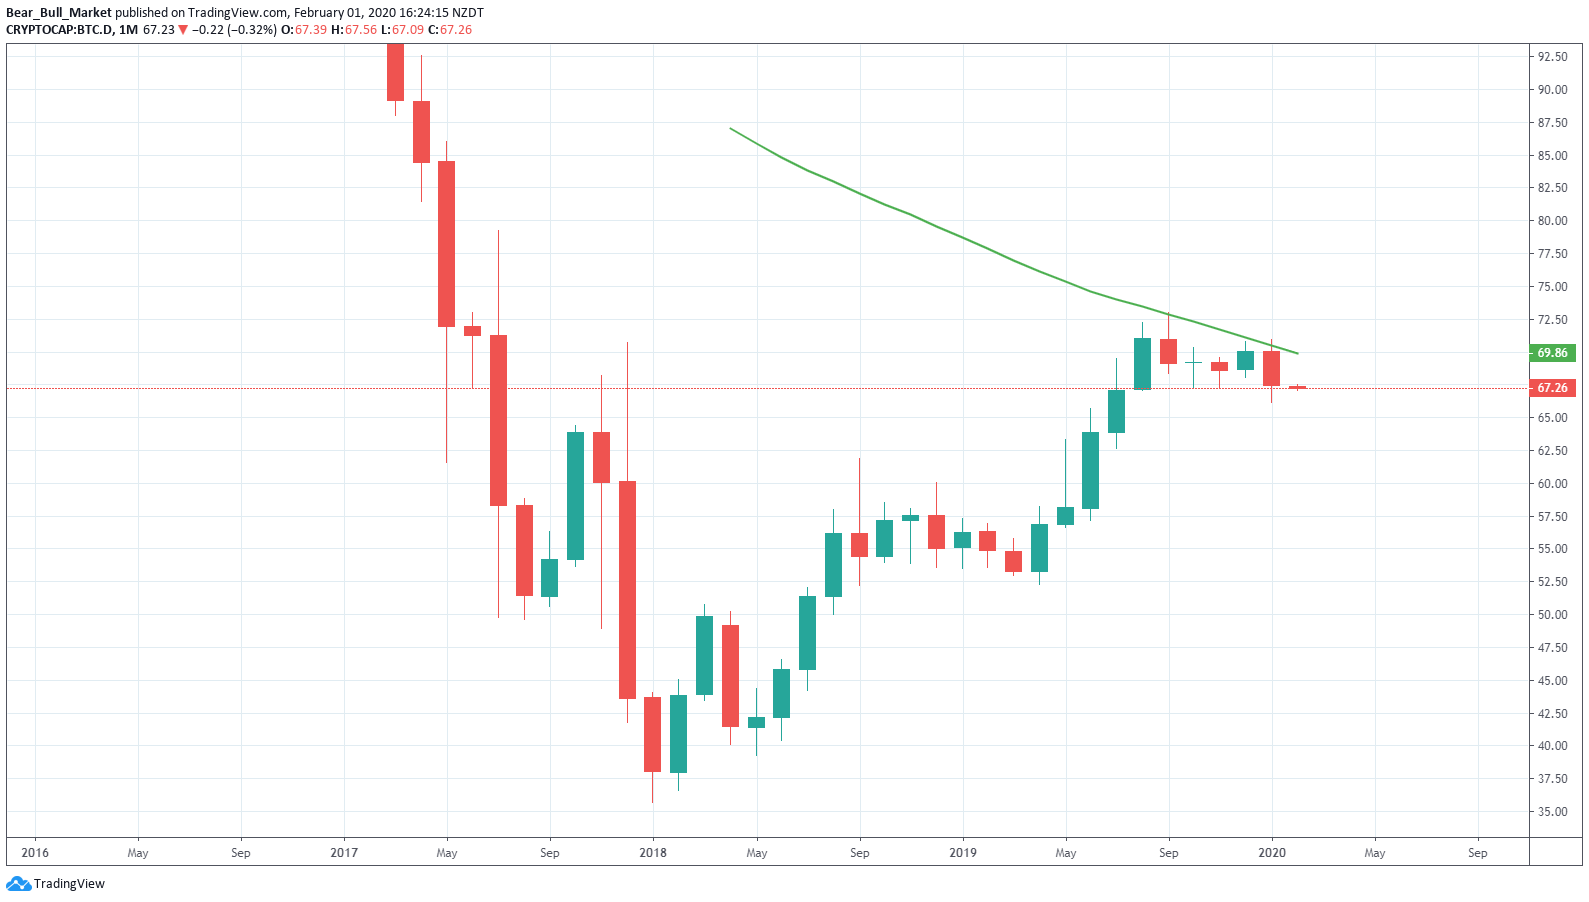
[Bitcoin Dominance]
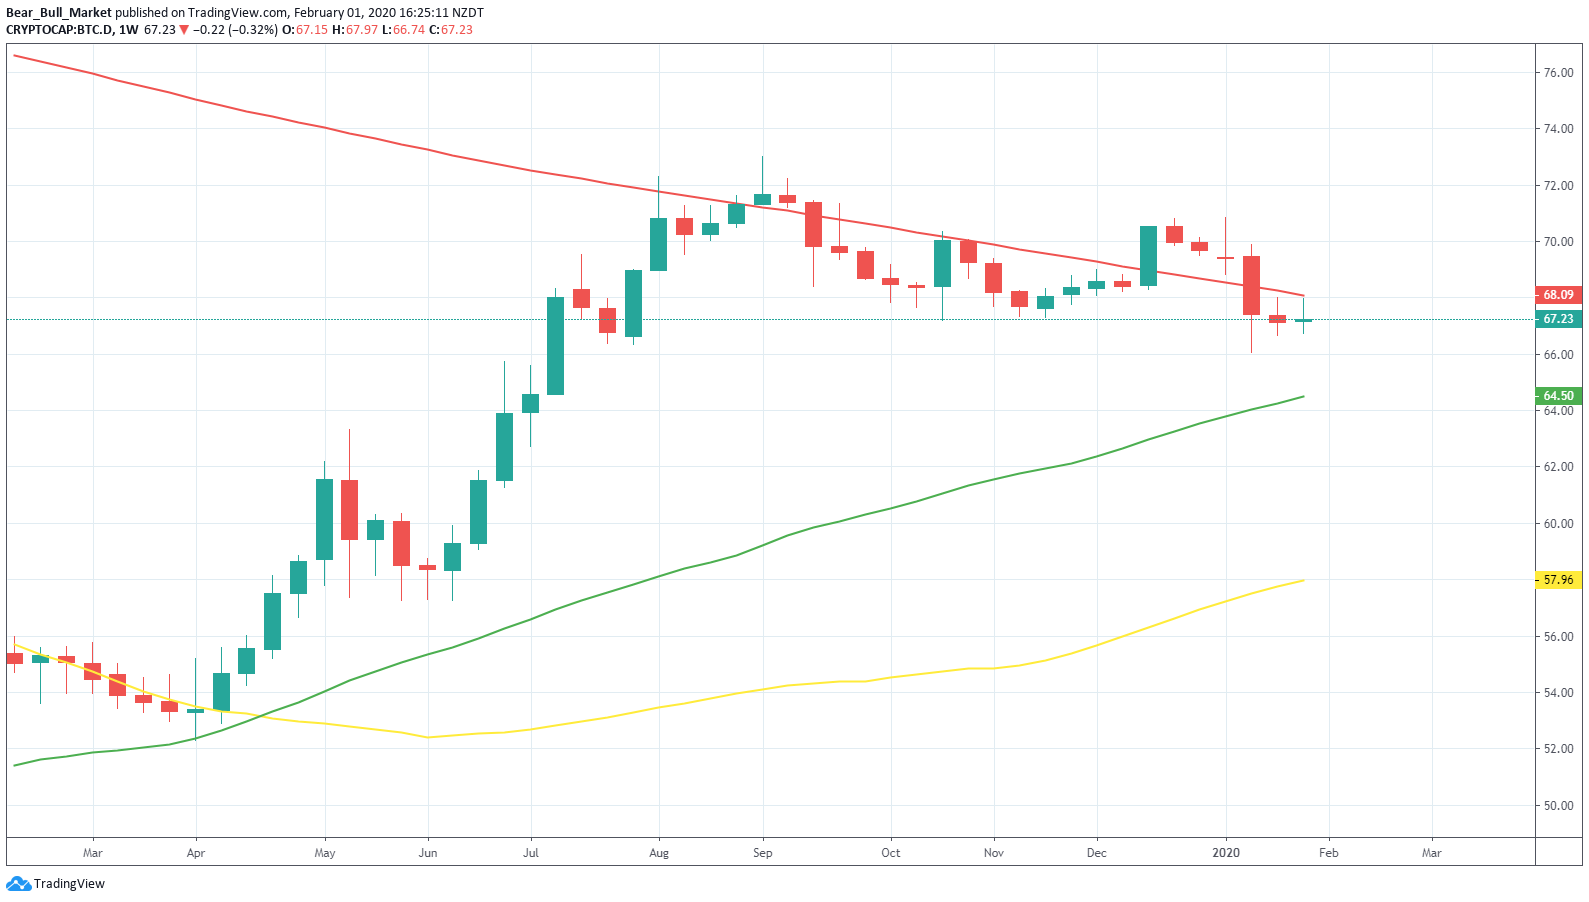
Something that has me concerned, yet excited me is the MONTHLY close on Bitcoin Dominance.
When we broke out from $4,000 in 2019, Dominance increased, rapidly leaving alts in the dust.
This month, while Bitcoin rallied 49.5% Bitcoin Dominance fell.
I’m not sure what to take from this yet.
However, the 50 Moving Average on the monthly has been resistance for Bitcoin Dominance for a while, and we’re starting to see Alt Coins pop off.
View the Trading View Charts
Keep an eye on the 50 Moving Average from the Weekly scale.
View the Trading View Charts